








Disclosure. Convexity builds research tools for public-market data. This note is analysis, not investment advice, and nothing in it is a recommendation to buy, sell, or short any security. We hold no position in Lennar or in any other company named here. Every figure comes from a company filing, a statistical agency, or a named index series, all linked at the bottom. Where a number is our arithmetic rather than a figure someone reported, we say so where it is used and collect the list at the end. Lennar's financial year ends on November 30, so the quarter discussed here, its third quarter of 2026, is the three months to August 31, 2026. This note follows our August 19 note on the housing market, scores the five things that note said would prove it wrong, and corrects two figures in it that have since been revised.
Lennar is the second largest homebuilder in the United States, and on September 16 it told investors that its incentives had come down again. The share of the price it gives back to buyers fell to about 12.0%, from 12.9% three months earlier and 14.5% at the end of last year.
Read that line on its own and it is the beginning of a housing recovery. It is the exact thing our August note named as the likeliest way to prove itself wrong: builders stop discounting, demand returns at the asking price, and the correction we described turns out to have ended.
It is not that. In the same release Lennar sold 9% fewer homes than a year earlier and got about 2% less for each one. It came in below the guidance it had given three months earlier on orders, on price and on margin. And it cut its full-year delivery target for the second quarter running, to a level below what it actually delivered last year. Its chief executive said conditions had "deteriorated since our last earnings call."
The week around the release was no kinder. The Federal Reserve raised interest rates, the average thirty-year mortgage reached its highest level since January 2025, and a survey of Lennar's competitors found more of them cutting prices than in August, not fewer.
The incentive number and the housing market are both real. They are measuring different things, and this note is about the gap between them.
The quarter Lennar reported
Two words do a lot of work in a homebuilder's release, and they are worth separating before anything else.
A delivery, also called a closing, is a house handed over to a buyer. It is the moment revenue is booked. A new order is a house sold, meaning a contract signed. Because a Lennar home takes about four months to build, the houses it delivers in a quarter were largely sold in earlier months. Deliveries describe the past. New orders describe the present.
On deliveries, the quarter was soft but orderly. Lennar closed 20,840 homes, down 3% from a year earlier and inside the 20,500 to 21,500 it had guided to. The average price was $372,000, against $383,000. Gross margin, the share of the sale price left after land and construction costs, was 15.8% against 17.5%. Earnings were $1.19 a share against $2.29, with net income down 52% to $284 million.
On orders, it was worse. Lennar sold 20,879 homes against 23,004, a fall of 9%. It did that from 1,713 active communities, 49 more than a year earlier, so the sales pace per community fell from 4.7 homes a month to 4.1, both figures Lennar's own. The average price of those orders was $359,000 against $367,000.
Set the quarter against the guidance Lennar itself published in June, which is the fairest test of whether a company was surprised.
| June guidance for this quarter | What arrived | |
|---|---|---|
| New orders 21,000 to 22,000 | 20,879 | Below |
| Deliveries 20,500 to 21,500 | 20,840 | Inside |
| Average sales price $375,000 to $380,000 | $372,000 | Below |
| Gross margin approximately 16% | 15.8% | Under |
| Overheads 8.8% to 9.0% of home sales | 9.2% | Worse |
| Financial services earnings $95m to $100m | $129m, or $90m excluding one-time items | Beat, or missed |
Three of the six landed outside the range Lennar set three months earlier, and a fourth came in under the figure it approximated. Only deliveries landed inside. The last line is the one that needs care: financial services beat its guidance on the reported number, and missed it once a $39 million one-time gain from a litigation reversal is removed.
The full-year plan moved with the quarter. In December, Lennar expected to deliver about 85,000 homes in 2026, which it described as roughly 3% growth. In March it still expected 85,000. In June it cut to 82,000 to 83,000. In September it cut again, to 80,000 to 81,000. It delivered 82,583 homes in 2025, so a year that was planned as growth is now guided to a decline.
What the incentive rate actually measures
Now the number in the headline.
"Incentives" in homebuilding means everything a builder gives back to make the payment work: buying down the buyer's mortgage rate, paying closing costs, throwing in options and upgrades, and cutting the price. Lennar reports it as a percentage, and the percentage has fallen for two quarters running.
Three things about that number are worth knowing before it is read as a recovery, and all three come from Lennar.
It is measured on closings, not on sales. The 12.0% is the discount on homes delivered in the quarter, which were mostly sold in earlier months. It describes the deals Lennar struck when conditions were better. What it struck deals at during this quarter shows up in the order price, and that fell.
It already includes price cuts. The wording in the release is easy to misread, because it says the average price reflects "approximately 12.0% in incentives, along with base price adjustments," which sounds as though price cuts sit outside the 12.0%. An analyst asked about exactly that on the June call. Lennar's chief financial officer, Diane Bessette, answered plainly:
It does include the base price adjustments. That's all in.
Diane Bessette, Lennar chief financial officer, second-quarter call, June 12, 2026
So the figure is the whole discount, not one slice of it. That makes the decline more meaningful than the wording suggests, and it also rules out the simplest bearish reading, which is that the discount merely moved from one line to another. It did not.
It cannot see a lower opening price. This is the part management volunteered, and it is the most useful sentence either of us could offer a reader. An incentive is measured against a base price that Lennar itself sets. When it opens a new community at a lower price, there is no discount to record. Stuart Miller, the chief executive, on the same call:
You're opening new communities that have different pricing. It's not even necessarily a price reduction. It's maybe a change in community A versus community B, and you open up at a lower price. We've seen our average sales price come down at the same time.
Stuart Miller, Lennar chief executive, second-quarter call, June 12, 2026
Lennar opened a net 30 communities during this quarter and 49 over the year. A measure of discounts against asking prices cannot tell you what is happening to asking prices.
Put the two series side by side and the shape is clear. The discount on what Lennar closed kept falling. The price of what Lennar sold, compared with the same quarter a year before, had almost stopped falling in the spring and turned down again.
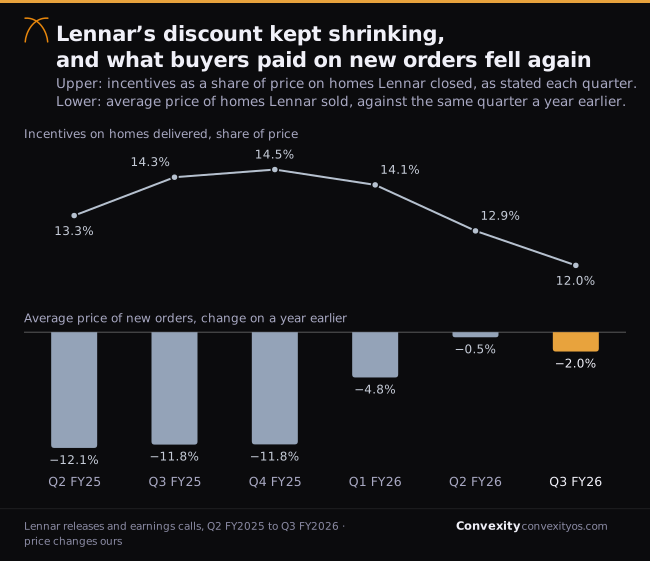
The comparison is quarter against the same quarter a year earlier on purpose. Homebuilding is seasonal, and Lennar's summer order prices are always below its summer delivery prices, in every one of the fifteen quarterly releases we read back to early 2023. Comparing a quarter with the same quarter a year before removes that. On that basis the average order price of $359,000 is the lowest in all fifteen.
Where the price went
A national average hides the decision a builder actually makes, which is taken market by market: hold the price and sell fewer, or cut the price and defend the pace.
Lennar did both, in different places.
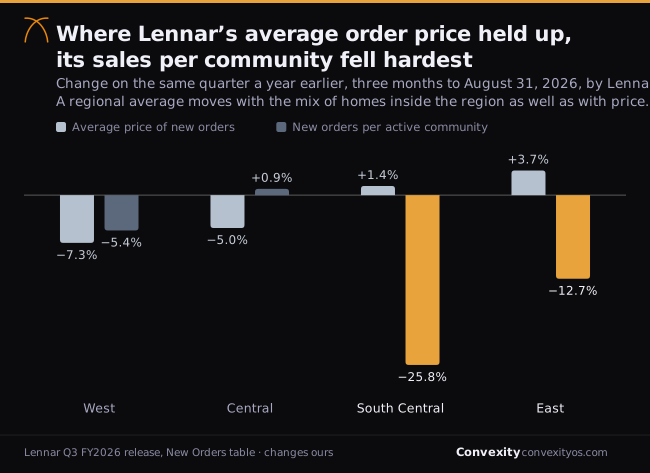
In the West, which for Lennar means Arizona, California, Colorado, Idaho, Nevada, Oregon, Utah and Washington, the average order price fell 7.3% and the pace per community fell anyway. In Central, prices fell 5.0% and the pace held.
In the East, which is Florida, New Jersey and Pennsylvania, and in South Central, which is mostly Texas, the average price held or rose, and the pace collapsed. Texas is the starkest: Lennar opened 17% more communities there and sold 26% fewer homes per community than a year earlier.
Management gave the reason on the call, and it connects this chart to the resale market described later in this note.
The resale seller has become a more aggressive competitor for our customer, especially at our price range. Resale supply has continued to rebuild and is now very competitive in price. Active listings nationally are back above historic levels. In Texas and in Florida, they are particularly high. Those are our two largest markets and states. When a resale seller cuts price, they are competing directly for our customer and we respond.
Stuart Miller, third-quarter call, September 17, 2026
Texas and Florida are the two states sitting inside the two regions where Lennar's pace fell hardest. The competition is not another builder. It is the existing-home inventory that has climbed to its highest months of supply in a decade, which is a resale market that had been frozen by low mortgage rates and is now negotiating again.
That quotation also disciplines how the chart should be read, so three cautions rather than two. Lennar says it responds on price where resale sellers cut, which is the opposite of holding the line, so a regional average that did not fall is not evidence that any particular house kept its price. A regional average moves with the mix of homes and communities inside the region as much as with price, and this note's mix adjustment is between regions, not within them. And the pace here is orders divided by the communities open at the quarter end, which is our construction. Lennar computes its own pace on an average-community basis, so our level differs slightly from the 4.1 homes a month it reports. The direction does not.
One thing the regional split does settle is that the national decline is not a trick of geography. If Lennar had simply sold more cheap Texas homes and fewer expensive Western ones, the average would fall without any house getting cheaper. We checked. Holding this quarter's regional mix at last year's regional prices, the mix actually worked in Lennar's favour by about 0.6 of a percentage point. Within regions, prices fell 2.7%, more than the 2.0% headline.
The market Lennar is selling into
Everything above is one company. The month around it was worse, and that is the part of this note that applies to anyone who owns a house rather than a homebuilder.
The Federal Reserve raised rates. On September 16, the afternoon Lennar reported, the Federal Open Market Committee voted 12 to 0 to raise the federal funds rate, the policy rate it sets, by a quarter point to a range of 3.75% to 4%. The statement said inflation "remains elevated" and that the Committee "will deliver price stability." Its published projections imply one more increase before the end of the year.
Mortgage rates reached a twenty-month high. Freddie Mac's weekly survey put the average thirty-year fixed rate at 6.95% on September 17, up 19 basis points in a week, which is a hundredth of a percentage point each. That is the highest since January 30, 2025, and the largest weekly rise since April 2025. It is 69 basis points above where the same survey sat a year ago and 97 above its February low.
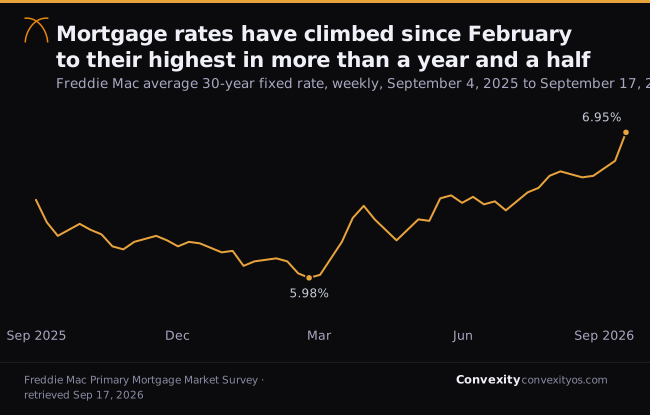
The timing matters and cuts against the obvious story. Freddie Mac surveys lenders from Monday to Wednesday, so most of that 6.95% was gathered before the Fed announced anything. The rise is the bond market moving ahead of the decision, not a reaction to it.
Lennar put the rate at "approximately 6.8%" at its quarter end and said it had gone higher since. Freddie Mac's survey read 6.66% in the same week, so the 6.8% is Lennar's own figure from its own source. The direction is not in dispute.
More builders are discounting, not fewer. The National Association of Home Builders runs a monthly survey of its members. Its confidence index fell three points in September to 32, the lowest since September 2025 and the seventeenth consecutive month below 40, the longest such run since the one that ended in August 2012. The component measuring what builders expect over the next six months fell six points to 37.
Inside that survey are the two numbers our August note named as its test. In September, 38% of builders cut prices, up from 35% in August. And 66% used sales incentives, up from 63%, the highest share since December. Both moved away from recovery, not toward it. Lennar's own rate fell while its industry's rose, which is another way of seeing that Lennar's figure is about Lennar.
Sales fell out of the range they had held for two years. Existing-home sales, which are roughly nine in ten of all American home sales, ran at an annual rate of 3.98 million in August, down 2.0% on the month and 1.2% on the year. Our August note said these had been pinned between 4.0 and 4.1 million, and named a decisive move above that as a sign we were wrong. They moved below it instead, for only the second time since October 2024.
Inventory is the other half of that. There were 1.62 million homes for sale in August, the first time above 1.6 million since November 2019. That is 4.9 months of supply, meaning the listed stock would take that long to clear at the current pace of sales. The association calls it the highest in over ten years.
The median is still rising, and still losing to inflation. The median existing home sold for $429,100 in August, up 1.6% from a year earlier, the thirty-eighth consecutive month of annual increases. Consumer prices rose 3.4% over the same twelve months, unchanged from July, with energy up 16.3%. Subtract one from the other and the typical American house lost roughly 1.8 percentage points of purchasing power over the year. That subtraction is ours, but the same conclusion now comes from the index provider directly: S&P said in its June release that "for the 13th consecutive month, U.S. home values fell in real terms."
The regional pattern in resale prices matches Lennar's. The West's median fell 0.2% over the year, the South's rose 0.7%, while the Northeast's rose 4.3% and the Midwest's 3.3%. The West is where Lennar cut hardest.
What the revisions did to our August note
Two figures in our August note have been revised by the agencies that published them, and one comparison in it was drawn across mismatched months. All three are our responsibility to correct, so they go here rather than in a footnote.
Housing starts. Our August note reported that starts fell to an annual rate of 1,239,000 in July, "down 12.4% on the month and 13.5% on the year, with both moves large enough to clear the Census confidence intervals." That was accurate as the Census Bureau published it on August 18. On September 17 the Bureau revised July's starts up to 1,309,000 and July's completions up from 1,212,000 to 1,280,000. A 5.6% revision is larger than the 3.8% or less the Bureau says its preliminary estimates typically move. The 13.5% annual decline we quoted no longer stands.
The lesson is not that the number moved. It is that we leaned on a single month when the Bureau's own release says "it may take ... six months for total starts, and six months for total completions" to establish a trend. The steadier comparison is the year so far against the same months last year, and it says something different from what we implied and, in one respect, worse.
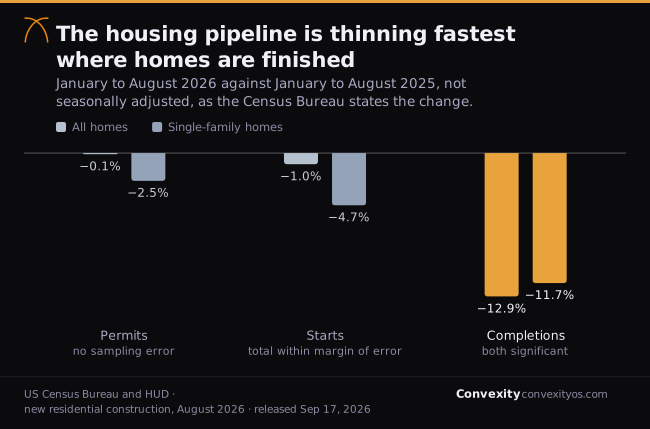
Starts across the year are down 1.0%, which is inside the margin of error and therefore not distinguishable from flat. Single-family starts are down 4.7%, which is outside it. Completions are down 12.9%, comfortably outside. So the pipeline is thinning where homes are finished rather than where they are begun, which is the claim our August note made under the heading "the pipeline is draining from the back." That claim survives, on better evidence. The claim that starts had collapsed does not.
One further piece of the August argument is unchanged and now stronger: homes authorized but not yet started stood at 280,000 in August, up 12.9% on the year, a statistically significant rise. Builders are still accumulating permits they have not exercised.
The new-home median. Our August note cited a June median new-home price of $398,300, down 2.7% on the year, and used it for the finding that a new house had become cheaper than a used one. June has since been revised to $403,100. The finding survives on better footing, because we no longer need to compare two different months: in July, the median new home sold for $393,800 and the median existing home for $434,100.
A comparison we should not have drawn. The August note set the July median, up 2.0%, against the May Case-Shiller index, up 1.1%, and read the gap as evidence that the mix of what sold was flattering the headline. Those are two different months. Compared properly, in June the median was up 1.8% and Case-Shiller up 1.5%, a gap of 0.3 points rather than 0.9. The mix argument is weaker than we made it look. More on that below, because it is also one of the five things we said would prove us wrong.
How our August falsifiers scored
Our August note named five things that would break its argument, each observable in a public release within two or three months. Four have not happened. One is happening.
| What we said would prove us wrong | What the data did | Read |
|---|---|---|
| Inflation falls back toward 2% and stays down | Consumer prices held at 3.4%, and the Fed raised rates rather than cutting | Against it |
| The seven negative Case-Shiller metros turn positive | All seven were still negative in June | Against it |
| Builders stop discounting into volume | Price cuts rose to 38% of builders and incentives to 66%, both the wrong way | Against it |
| Existing sales break above the 4.0 to 4.1 million band | They broke below it, to 3.98 million | Against it |
| Repeat-sales indices re-accelerate while the median decelerates | Case-Shiller went from 1.2% to 1.5% while the median went from 2.0% to 1.6% | This one is firing |
The fifth deserves its own paragraph, because it is the one that costs us something.
A repeat-sales index like Case-Shiller tracks the same houses selling twice, so the mix of what happened to sell cannot move it. That is why our August note used it to argue that the median, which can be pushed up simply by losing the cheapest buyers, was flattering the market. For that argument to hold, the repeat-sales measure should stay below the median and ideally keep softening. Instead it has risen for two months, from 1.2% in May to 1.5% in June, while the median has come down. Corrected to matched months, the gap between them is now 0.3 of a percentage point.
That does not overturn the note's conclusion, because the conclusion rested on more than the gap: seven metros are still falling in nominal terms, every measure is below inflation, and the volume and builder evidence has moved against housing since. But the specific claim that mix was doing most of the work in the headline median is weaker than we wrote it, and if the next two prints continue this way it will be wrong.
The case against this note
The strongest arguments the other way, including the two we find hardest to dismiss.
Lennar's discount really is falling, and that really is new. From 14.5% to 12.0% in three quarters is not noise, it is the largest sustained improvement in three years, and Lennar's chief financial officer confirmed it is an all-in number. Gross margin has ticked up from its 15.2% low for two quarters running. A reader who concludes the worst of the discounting is over has real evidence, and this note does not have a better explanation for the fall than Lennar's, which is that its costs came down. Construction cost per square foot is down 6% over the year and its build cycle is at a record low of 116 days.
One builder is not the market, and this builder has an unusual strategy. Lennar has said for three years that it will hold volume and let price do the adjusting, and on this call it said the compromise is "deliberate, and it is not something the market is doing to us." A company that prioritizes pace will show falling prices in any soft market, so its order price is partly a decision rather than a reading. D.R. Horton, PulteGroup and Toll Brothers may show something else. KB Home reports on September 22, five days after this quarter's figures, and is the nearest available check.
Another large builder reportedly sees the opposite. This objection was put to Lennar on its own call, by an analyst who said that across his checks of the housing complex, including one with a very large builder the previous day, "the feeling we're getting is that the market has moved from a state of correction to maybe early signs of stabilization." Miller did not dispute the observation. He argued it is a market split by price point, with the affordable end where Lennar operates far more sensitive to rates and the cost of living than the higher end. That is a coherent answer, and it is also an admission that builders serving different buyers are reading this market differently. We are reporting one of those readings.
The order price is an average, and averages move for reasons other than price. Within a region, a shift toward smaller homes or cheaper submarkets pulls the average down with no house repricing. Our mix adjustment is regional only, and Miller's own point about opening communities at different prices cuts in this direction too.
Affordability improved on the measures buyers actually feel. The realtors' affordability index rose to 104.7 from 101.2 a year earlier, and improved in every region. Wages grew 3.1% in August against a median price rising 1.6%. That is the mechanism by which a correction paid in inflation eventually ends.
Inventory rising is not only a bearish signal. More homes for sale gives buyers room to negotiate and can unfreeze a market that has been stuck near four million sales for two years. It is also what a market looks like just before volume recovers at lower real prices.
The rate move may not last. The increase was largely priced in before the Fed acted, the Fed did not touch its balance sheet, and a single week's survey is a single week. If the thirty-year returns to the low sixes, most of what this note describes eases.
What would change the read
Named in advance so it can be scored rather than argued.
| Trigger | When | Why it matters |
|---|---|---|
| KB Home's incentives and order prices | Sep 22, 2026 | The nearest independent check on whether Lennar's order-price decline is the market or its own strategy |
| Lennar's new-order incentive rate | Dec 2026 | Disclosed in earlier quarters, not in September. It leads the delivery rate because it describes homes being sold. A new-order rate below 12% alongside a firmer order price would be a genuine turn |
| The cost of Lennar's rate buydowns | Dec 2026 | Management named this as where incentive pressure would show up next if rates stay here. It is the mechanism that would push the falling rate back up |
| The builder price-cut share | Oct 2026 | Back below 35%, and the third falsifier above starts moving for real |
| Case-Shiller, July and August | Sep 29 and Oct 27, 2026 | Two more prints. If the seven negative metros turn and the index keeps accelerating, the fifth falsifier has fired and we will say so |
| Existing-home sales | Oct 2026 | Back above 4.0 million with inventory still rising would mean the standoff is clearing rather than deepening |
| Mortgage rates | Weekly | Below 6.5% removes the proximate cause of everything above |
| The Fed's December meeting | Dec 2026 | Its projections imply one more increase. A pause would matter more to housing than anything a builder says |
The honest summary is narrower than the headline in either direction. Lennar is giving away less on the homes it closes, and it is getting less for the homes it sells. The first is a real improvement in a number that looks backward and cannot see a repriced community. The second is what the market paid it this quarter. Nothing in the month around it, from the Fed to the mortgage rate to the builder survey to the sales rate, argues that the second is about to follow the first.
What the call added
Four things from the September 17 call bear on the argument, and one of them cuts against it hard enough to reshape the section above.
June's optimism was not repeated. The June release said the gap between Lennar's incentives and a normal level was "narrowing for the first time in three years." Nothing like that was said in September. What Miller said instead was that the quarter was execution "in a market that has, if anything, gotten more difficult since we last spoke in June," and, about the guidance it missed, "We don't like missing. We missed this quarter. It didn't feel good. The landscape shifted."
The Federal Reserve is not coming. Miller was direct about what the rate decision the previous afternoon means for a homebuilder.
The Federal Reserve's assistance is clearly off the table for practical purposes and not a near-term source of relief. Rate cuts, when they eventually come, will be a meaningful tailwind for our business. But we are not holding our breath or waiting for them, and we are not building our business plan around those rate cuts.
Stuart Miller, third-quarter call, September 17, 2026
He put the thirty-year mortgage at approximately 7% on the morning of the call, against 6.4% to 6.5% at the June call, and the ten-year Treasury at around 5%. Freddie Mac's survey that same morning read 6.95%, so the two sources agree. He also said almost half of Lennar's visitors cannot immediately qualify for a mortgage.
The margin gap is land, not discounting. This is the strongest thing management said, and it is a genuine answer to anyone reading the margin compression as a pricing failure. Measured against 2023, Lennar's revenue per square foot is down 13% and its construction cost per square foot is down 14%, so the vertical half of the business has fully offset price with cost. What has not been offset is land, bought and underwritten in a different market, with cost per homesite up about 6% and option maintenance fees accumulating as the company slows down. "That is the entire margin gap," Miller said. "It is not labor, it is not material, it is not overhead. It is land."
And the choice is deliberate. Lennar does not dispute that it is trading price for volume. It insists on it.
We are compromising margin in order to maintain volume. Of course, we understand that it is a choice. It is deliberate, and it is not something the market is doing to us.
Stuart Miller, third-quarter call, September 17, 2026
That sentence is the sharpest limit on everything in this note. The order price fell partly because Lennar decided it should. A reader who takes the falling order price as a pure reading of demand is taking a company's strategy for a market signal, and the company said so in plain words.
Two smaller things. The chief operating officer, asked about the fourth quarter, said that "in some cases, our incentives actually go down because we get the pricing right," which is the same mechanism the June call described from the other direction: where the base price is set correctly, less discount is needed to clear the home. And the executive vice president for homebuilding warned that pressure on incentives in the fourth quarter "might come in the form of the cost of our rate buy-downs," so the rate that fell this quarter has a visible way of rising next.
One thing the call did not give, and it is the number this note most wanted: the incentive rate on new orders. Lennar disclosed it in earlier quarters, and it leads the rate on deliveries because it describes homes being sold rather than homes being closed. It was not stated in September.
Primary sources
- 8-KLennar third quarter 2026 earnings release, exhibit 99.1Every Lennar figure for the quarter: deliveries, new orders and their regional tables, the 12.0% incentive rate, gross margin, the pace of 4.1 homes per community per month, the fourth-quarter guidance, and the cut in the full-year delivery target to 80,000 to 81,000 homesFiled Sep 16, 2026
- 8-KLennar second quarter 2026 earnings release, exhibit 99.1The June guidance this quarter is scored against, the 12.9% incentive rate, and the statement that the gap to normalized incentive levels of 4% to 6% was "narrowing for the first time in three years"Filed Jun 11, 2026
- CallLennar third quarter 2026 earnings callChief executive Stuart Miller on a market that has "gotten more difficult since we last spoke in June", on missing the guidance, on the Federal Reserve being "off the table", on resale sellers in Texas and Florida competing directly for Lennar's customer, on land being "the entire margin gap", and on the margin compromise being "deliberate, and it is not something the market is doing to us". Also the thirty-year rate at approximately 7% and the ten-year near 5% on the morning of the call, revenue per square foot down 13% against construction cost per square foot down 14% since 2023, chief operating officer Jim Parker on incentives falling where the pricing is right, executive vice president David Grove on buydown cost as the next source of incentive pressure, and the analyst exchange on another large builder seeing early signs of stabilizationHeld Sep 17, 2026
- CallLennar second quarter 2026 earnings callChief financial officer Diane Bessette confirming the incentive figure "does include the base price adjustments, that's all in", and chief executive Stuart Miller on opening new communities at lower prices without recording a price reduction. Both are quoted in full aboveHeld Jun 12, 2026
- CallLennar first quarter 2026 earnings callThe 14.1% incentive rate on deliveries, the observation that the new-order incentive rate was below it, and the full-year delivery target of 85,000 homes still standing in MarchHeld Mar 13, 2026
- CallLennar fourth quarter 2025 earnings callThe 2026 delivery plan of approximately 85,000 homes, described as roughly 3% growth, and normalized incentive levels of 4% to 6% against 14% thenHeld Dec 17, 2025
- CallLennar third quarter 2025 earnings callThe 14.3% incentive rate, the peak of the series on this cardHeld Sep 19, 2025
- CallLennar second quarter 2025 earnings callThe 13.3% incentive rate that opens the seriesHeld Jun 17, 2025
- 8-KLennar third quarter 2025 earnings release, exhibit 99.1The prior-year quarter throughout, and the sales pace of 4.7 homes per community per month this quarter is compared againstFiled Sep 19, 2025
- 8-KLennar fourth quarter and full year 2025 earnings release, exhibit 99.1Full-year 2025 deliveries of 82,583 homes, the figure the new 2026 target falls belowFiled Dec 16, 2025
- FedFederal Open Market Committee statementThe 12 to 0 vote to raise the target range by a quarter point to 3.75% to 4%, and the language on inflation remaining elevatedSep 16, 2026
- DataFreddie Mac Primary Mortgage Market SurveyThe weekly thirty-year fixed average: 6.95% on Sep 17, 2026, 6.76% the week before, 5.98% on Feb 26, 2026 and 6.26% on Sep 18, 2025. The full weekly history is published as a spreadsheet from the same pageRetrieved Sep 17, 2026
- NAHBBuilder sentiment falls on higher interest rates and costsThe September Housing Market Index at 32, its components, and the survey shares: 38% of builders cutting prices, average cut 6%, and 66% using incentives. Published by the association's own economics team; the index tables are at nahb.org/hmiSep 16, 2026
- NARExisting-home sales, August 2026The 3.98 million annual rate, 1.62 million of inventory, 4.9 months of supply, the $429,100 median and its 1.6% annual rise, the regional medians and the affordability indexSep 10, 2026
- NARExisting-home sales, June 2026The June median of $440,600, up 1.8%, used for the matched-month comparison with Case-ShillerJul 9, 2026
- S&PS&P Cotality Case-Shiller Index reports annual gain in June 2026The national index up 1.5% against 1.2% in May, the thirteenth consecutive month of real declines, and the seven metros still falling: Seattle, Las Vegas, Denver, Tampa, Phoenix, Dallas and Portland. Detroit has no valid June printAug 25, 2026
- CensusNew residential construction, August 2026The year-to-date changes in the pipeline figure, the revisions to July, the 280,000 units authorized but not started, and the note that six months are needed to establish a trend in starts and completionsSep 17, 2026
- CensusNew residential construction, July 2026The first print our August note quoted: starts of 1,239,000 and completions of 1,212,000, both since revised upwardAug 18, 2026
- CensusNew residential sales, July 2026The $393,800 July median for a new home, the revised June median of $403,100, and 9.6 months of supplyAug 25, 2026
- BLSConsumer Price Index, August 2026Consumer prices up 3.4% over twelve months, unchanged from July, core at 2.4% and energy at 16.3%Sep 11, 2026
Not investment advice. This is a reading of public filings and public statistics, published for research purposes. It is not a recommendation to buy or sell any security and it is not a price target. We hold no position in Lennar or in any other company named. Anyone acting on any of it should read the sources themselves, which are linked above.
What here is ours rather than the source's. Lennar reports homes, dollar values and average prices; every change over time computed from them is ours, including the 9% fall in orders by dollar value, the 2.0% fall in the average order price, the regional price and pace changes, and the finding that the average order price is the lowest in the fifteen quarterly releases we read. The separation of that fall into a within-region price effect of 2.7% and a mix effect of 0.6% is ours. The pace figures are orders divided by communities open at the quarter end, which is our construction and not Lennar's. The comparison of the quarter against June's guidance is ours, assembled from the two releases. The subtraction of consumer price inflation from the median home price is ours. The incentive rates, the Fed's decision, the mortgage rates, the builder survey shares, the sales and inventory figures and every Census percentage change are as the source stated them.
Corrections to our August 19 note. Three, described in full above. The Census Bureau has revised July housing starts up from 1,239,000 to 1,309,000 and July completions up from 1,212,000 to 1,280,000, so the 13.5% annual decline in starts that note reported no longer stands; the year-to-date comparison replaces it. The June median new-home price it cited as $398,300 has been revised to $403,100. And its comparison of the July median with the May Case-Shiller index was drawn across mismatched months, which overstated the gap between them. That note has been amended to record all three.