









Disclosure. Convexity builds research tools for public-market data, and this note is analysis rather than investment advice. Nothing here is a recommendation to buy, sell, or short anything. One disclosure is specific: a member of the Convexity team is a Lowe's employee and holds Lowe's stock through its employee stock purchase plan. We hold no other position in any company named below. Every figure is linked to the release it came from, and where a number comes from a commentary series or a press summary rather than a statistical agency, the sentence says so.
Correction, September 17, 2026. Three things in this note have since changed, and a follow-up note on the September data covers all three in full.
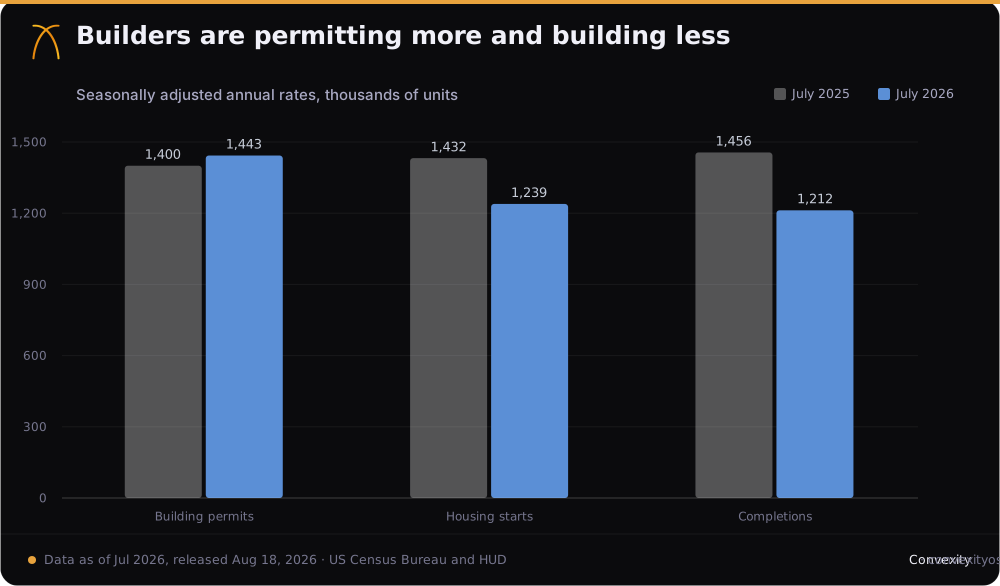
Housing starts. The section below reports July starts at a 1,239,000 annual rate, down 13.5% on the year. That was the figure the Census Bureau published on August 18. On September 17 it revised July starts up to 1,309,000 and July completions up from 1,212,000 to 1,280,000, so the 13.5% decline no longer stands and the chart below shows first-print figures. The steadier comparison, which the Bureau itself recommends because a trend in starts takes about six months to establish, is the year to date: through August, starts are down 1.0%, inside the margin of error, single-family starts are down 4.7%, and completions are down 12.9%. This note's argument that the pipeline is draining from its finished end survives on that evidence. Its statement that starts had collapsed does not, and we should not have leaned on a single month.
The new-home median. The June median new-home price of $398,300 cited below has been revised to $403,100. The finding it supported, that a new house now sells for less than an existing one, holds on matched months: in July the medians were $393,800 new against $434,100 existing.
A comparison we should not have drawn. The section below sets July's existing-home median, up 2.0%, against the May Case-Shiller index, up 1.1%, and reads the gap as evidence that mix was flattering the headline. Those are two different months. On matched months, June was 1.8% against 1.5%, a gap of 0.3 points rather than 0.9, so that argument is weaker than we made it look.
American housing has one statistic everybody quotes, and it is the one statistic structurally unable to show what is happening. The median price of an existing home sold in July was $434,100, up 2.0% from a year earlier, the thirty-seventh consecutive month of annual gains (NAR, Aug 2026). Read that line by itself and the market is boring. Slightly up, slowly grinding, nothing to look at.
Nearly every other series says something else. Real prices, adjusted for the inflation that came back this year, have been falling. Seven of the nineteen metros in the Case-Shiller panel are down in nominal terms. Builders, the only sellers who cannot wait, are cutting prices and stacking incentives so heavily that a new house now costs less than the median used one. Volume has been frozen near four million sales a year because the sellers who do not have to transact are not transacting.
This is a correction. It is being paid in inflation, incentives, mix, and time instead of in sticker price, which is why it does not look like one.
The number doing all the work
Start with what a median is. It is the price of the house in the middle of the transactions that actually closed. It is not the change in value of American houses, and when the composition of who is buying shifts, it moves for reasons that have nothing to do with prices.
The composition has shifted hard. NAR's annual profile of buyers and sellers, covering transactions from July 2024 through June 2025, put first-time buyers at 21% of the market, the lowest share since the association began tracking it in 1981, with the median first-time buyer aged 40, also a record (NAR 2025 Profile). The monthly release is a different instrument covering a different window, and it put first-time buyers at 29% of July's sales (NAR, Aug 2026). Those are not two readings of one thing and they should never be netted against each other. What they agree on is direction: the entry-level buyer is the marginal participant, and the marginal participant leaves first.
The reason the bottom rung left is the payment. NAHB's Cost of Housing Index for the first quarter found a family earning the national median income of $106,800 needed 32% of it to carry the mortgage on the median-priced new home at $403,200, and the same 32% for the median existing home at $404,300. A family at half the median needs 65% for the same house (NAHB, May 2026). Seven of the 175 metros it covers were severely cost-burdened, with the mortgage above half of median family income, and 59 more sat between 31% and 50%. A first-time buyer is, almost by definition, the household on the wrong side of that split.
All-cash buyers were 26% of July's sales. Inventory stood at 1.54 million homes, 4.6 months at the current pace, and the typical listing went under contract in 29 days.
Now the arithmetic. Remove the entry-level tier from a market and the median rises whether or not a single house got more expensive. Skew the buyers who remain toward the Northeast, where July's median was $563,800, and it rises again. A median can climb through a period in which the price of any given house is falling, and in a market that has lost its bottom rung that is the expected behavior rather than an anomaly.
Volume shows how frozen this is. Existing-home sales ran at a 4.06 million annualized rate in July, down 1.7% on the month and up 0.7% on the year, with year-to-date sales up 2.4%.
Home sales have remained stable despite recent mortgage rate increases.
Lawrence Yun, NAR Chief Economist, July existing-home sales release
Stable is accurate. It is also what a standoff looks like from the inside.
A third of the country is already falling
The repeat-sales indices exist precisely because a median cannot answer the question above. Case-Shiller tracks the same houses selling twice, so mix cannot move it.
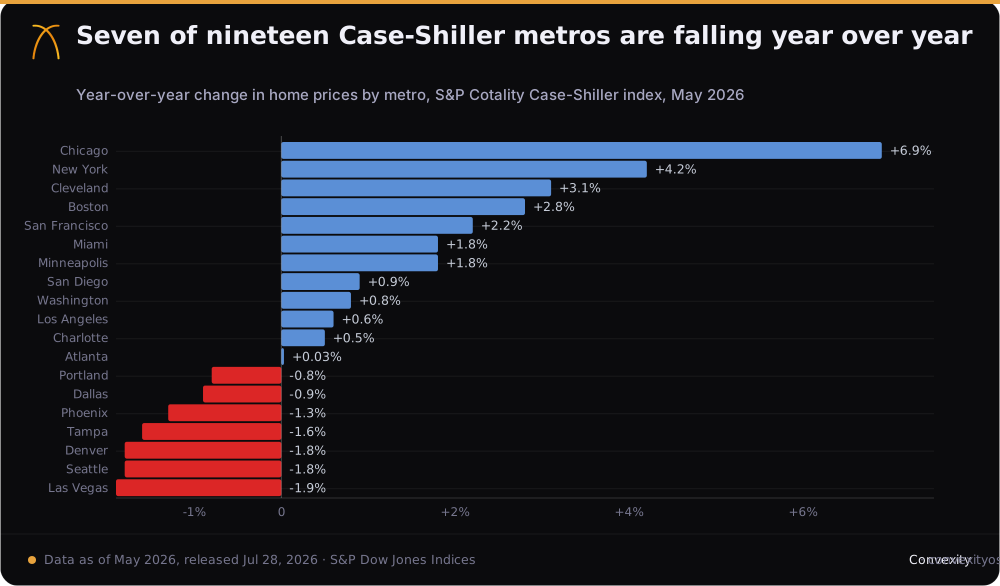
For May 2026, released July 28, the national index rose 1.1% year over year, the 10-city composite 2.4% and the 20-city 1.6% (S&P Cotality Case-Shiller, Jul 2026). The national figure is already softer than the median's 2.0%, which is the first hint that mix is flattering the headline. The dispersion underneath is the real story. Chicago gained 6.9%, New York 4.2%, Cleveland 3.1%. At the other end Las Vegas fell 1.9%, Denver and Seattle 1.8% each, Tampa 1.6%, Phoenix 1.3%, Dallas 0.9%, Portland 0.8%. Atlanta gained 0.03%, a rounding error from joining them. Detroit has no valid May print because of recording delays in Wayne County, so the release covers nineteen metros rather than twenty.
Seven of nineteen are negative in nominal terms, and almost nine points separate the top of the panel from the bottom. There is no single national housing market in that data. There is a Midwest and a Northeast holding an average up while the Sun Belt and the Mountain West fall.
NAR's regional medians say the same thing from the other side of the methodology (NAR, Aug 2026).
| Region | Median price, July 2026 | Year over year | What it carries |
|---|---|---|---|
| Northeast | $563,800 | +5.2% | The fastest of the four, and well ahead of the 2.0% national figure |
| Midwest | $342,900 | +2.8% | The cheapest median of the four, also ahead of the national figure |
| South | $371,700 | +0.9% | 1.86 million of the 4.06 million annualized sales rate |
| West | $622,200 | +0.2% | 730,000 of the sales rate, and the most expensive median |
The South is the point. At a 1.86 million annualized rate it is roughly 46% of national volume, and its median rose under a percent. The West added 0.2%. Together those two regions run about 2.59 million of the 4.06 million sales rate, close to two-thirds of every transaction in the country, and together they hold most of the negative Case-Shiller metros. The Northeast and Midwest, which are carrying the national median, account for the remaining 1.47 million between them, fewer deals than the South does alone.
The builders have already capitulated
Existing owners can wait. They have a payment they like, they have somewhere to live, and refusing to sell costs them nothing. Builders cannot wait. They carry land, work in progress, and debt, and a finished house that does not sell is a financing cost compounding every month. When the two groups disagree about price, the builder is the one who blinks, and the builder blinked more than a year ago.
The NAHB/Wells Fargo Housing Market Index read 35 in August, up a point on the month and the sixteenth consecutive month below 40, the longest such run since 2012 (NAHB, Aug 2026). Inside the index, current sales conditions were 39 and expectations 43, but buyer traffic was 23. Traffic is the component that measures whether anyone walked in the door.
The behavioral numbers are blunter than the sentiment ones. In August, 35% of builders cut prices, down from 37% in July, at an average reduction of 6%, and 63% used sales incentives, the sixteenth straight month at 60% or higher. That is not a discount cycle. That is a pricing regime.
The regional breakdown maps almost exactly onto Case-Shiller: 44 in the Northeast and 45 in the Midwest against 31 in the South and 27 in the West. Two independent measurements, one built from transaction prices and one from a survey of builders, drawing the same map of the country.
Then the number that should have been the headline. The median new home sold in June went for $398,300, down 2.7% year over year (Census and HUD, Jul 2026). The median existing home in July went for $434,100. A new house is now cheaper than a used one.
Some of that inversion is composition rather than concession. A builder trying to hit a monthly payment builds a smaller house, and a smaller house carries a lower price without necessarily carrying a lower price per square foot. But that is the finding, not a rebuttal to it. The only participants in this market obliged to clear it are doing so by delivering less house for less money, and they are still holding 485,000 units for sale, 9.3 months of supply at June's 628,000 annualized sales rate. The existing market's inventory is 4.6 months.
New-home median and months supply from the Census and HUD new residential sales release for June 2026; existing-home median and inventory from NAR's July 2026 release; incentive share from the NAHB Housing Market Index for August 2026.
The income statements are less polite
A survey records what builders say. An income statement records what they did, and four filings from the past ten weeks put dollars behind the NAHB numbers.
Lennar's quarter ended May 31. Deliveries rose 2% to 20,519 homes while new orders fell 4% to 21,749, the average sales price came down 5% to $371,000 from $389,000, and home-sales gross margin compressed to 15.6% from 17.8%. Incentives ran about 12.9% of the sales price against a normalized 4% to 6% (Lennar, Jun 2026). Set that beside the survey. NAHB has 63% of builders offering incentives at an average cut of 6%. Lennar's books show roughly 13% given away on top of a price already 5% lower.
D.R. Horton, whose quarter ended June 30, tells it through cancellations. Net sales orders were flat at 23,084 homes and closings rose 4% to 23,983, but the cancellation rate went to 20% from 17% (D.R. Horton, Jul 2026). Volume held level while one in five signed buyers walked.
The retailers read the frozen side, because home-improvement spending tracks turnover: people renovate around moves. Home Depot grew comparable sales 1.7%, and 1.3% in the US, on $47.9 billion of sales (Home Depot, Aug 2026). Those US comps grew more slowly than consumer prices are running, and the release says why: customers "continued to engage in smaller projects". Lowe's, a day later, grew comparable sales 0.2%, carried by Pro, home services, and online sales up 15.7%, "partially offset by persistent DIY macro pressures", and cut its full-year outlook to approximately flat from flat to 2% (Lowe's, Aug 2026). The homeowner who will not sell is also not starting the big renovation.
One thing in these filings cuts against us, and it belongs here. Lennar's Stuart Miller says the gap between 12.9% and a normal incentive load "is narrowing for the first time in three years", and D.R. Horton's 20.7% gross margin beat its own guidance partly by pulling incentives back, though it still expects them elevated through the current quarter. That is the third falsifier below beginning to move. The direction has changed before the level has.
Inflation took over the correction
Housing corrections in living memory have been nominal. The price on the sign goes down. This one mostly is not, because the denominator moved.
Consumer prices rose 2.4% year over year in January 2026 and 4.2% in May, a three-year high, with energy up 23.5% on the year (BLS, Jun 2026; CNBC, Jun 2026). June eased to 3.5% and July to 3.4%, with core at 2.5% (BLS, Aug 2026).
Set May against May. Case-Shiller's national index gained 1.1% over the twelve months to May. Consumer prices gained 4.2% over the same twelve months. Subtract one from the other and the average American house lost roughly three percentage points of purchasing power across that year. That is not a model or a forecast. It is the difference between two published numbers, and it is the whole of the real-terms claim. A commentary series tracking the inflation-adjusted index counts twelve consecutive months of real declines (Advisor Perspectives, Jul 2026, retrieved 2026-08-19); that count is theirs rather than ours, but the arithmetic behind it is the subtraction above.
The same arithmetic runs on the buyer's side, and it is the cleanest illustration of the argument. Redfin puts the income needed to afford the typical US home at $109,796 in June, down 0.5% from the record $110,382 a year earlier, against an estimated median household income of $87,599, up 4% from $84,257. The gap has closed for two straight years, from $28,834 to $26,125 to $22,197, and 34.2% of listings cleared a 30%-of-income affordability threshold, up from 30.5%, though before rates rose in 2022 more than half cleared it in nearly every month back through 2013 (Redfin, Aug 2026, retrieved 2026-08-19). Affordability improved, and almost none of it came from price. Income rose 4% while the income a buyer needs fell half a percent. That is the real-terms decline above, seen from the household rather than the index. Redfin reads June listings at 15% down; the NAHB index reads a first-quarter share of median family income. The two are not one measurement and are not netted here.
The usual escape valve is rates, and it is shut. Freddie Mac's survey put the 30-year fixed at 6.67% on August 13, against 6.69% the week before and 6.58% a year earlier (Freddie Mac PMMS). Borrowing is more expensive than it was last summer, not less.
Sit with that, because of what was tried in between. On January 8 the administration directed Fannie Mae and Freddie Mac to buy $200 billion of mortgage-backed securities with the explicit purpose of pushing mortgage rates down, a directive FHFA Director Bill Pulte confirmed and which promptly picked up the nickname "People's QE" (Scotsman Guide, 2026, secondary reporting, retrieved 2026-08-19). Two hundred billion dollars of deliberate intervention aimed at exactly one number, and that number now sits nine basis points above where it was a year ago. We are not going to publish an estimate of where rates would have been without it, because we do not have one worth the pixels. The juxtaposition is the finding.
The pipeline is draining from the back
The Census construction report for July, released August 18, is the most consequential document in this file and it drew almost no attention.
Housing starts ran at a 1.239 million annualized rate, down 12.4% on the month and 13.5% on the year, with both moves large enough to clear the Census confidence intervals (Census, Aug 2026). Completions ran 1.212 million, down 16.8% on the year, also statistically significant. Single-family starts came in at 808,000, down 9.9% on the month, but the Census flags that particular move as within its margin of error, so we will not lean on it and neither should anyone else.
Permits went the other way, to a 1.443 million annualized rate, up 5.0% on the month and 3.1% on the year, with single-family permits at 894,000.
Read those together and you have the clearest statement of builder intent available anywhere. A permit is an option: cheap, revocable, worth holding through uncertainty. A start is the exercise, and it costs real money the moment it happens. Builders are accumulating options at a rising rate and exercising them at a collapsing one. Paper intent up, actual production and deliveries down double digits.
The consequence has a date on it. Houses that complete in 2027 and 2028 are being started now, at the sixteenth consecutive month of builder confidence below 40. That is the mechanism by which a demand-side freeze manufactures the next supply shortage, and part of it has already happened: completions down 16.8% is not a projection, it is deliveries that failed to occur.
Meanwhile the thing that froze the resale side is thawing without anyone's help. Redfin found that in the third quarter of 2025, for the first time, more mortgaged American homeowners held a rate above 6% (21.2%) than below 3% (20.0%) (Redfin, 2026, retrieved 2026-08-19). Coldwell Banker's 2026 report found 35% of sellers working with an agent held a rate below 5% and intended to list this spring regardless (Coldwell Banker, 2026, retrieved 2026-08-19). Lock-in is a wasting asset. It decays as people move, refinance, die, and buy at today's rate instead of 2021's.
The listings data is already registering it. Realtor.com's weekly series counted roughly 1.2 million active listings in the week ending August 8, up 3.2% year over year, with more than 100,000 price cuts in each of five consecutive weeks (Realtor.com data reported by TheStreet, retrieved 2026-08-19). Supply is arriving into a market where builders are already discounting and buyers are already missing.
What would make us wrong
The version of this argument worth reading is the one that says what would break it. Five things would, each observable in a public release within two or three months.
Inflation falls back and stays down. CPI has already eased from 4.2% in May to 3.4% in July. If it keeps moving toward 2% while nominal appreciation holds near 2%, the real-terms decline stops by arithmetic and the correction described here collapses into an inflation artifact that has already ended. This is the falsifier most likely to fire.
The negative metros re-accelerate. Tampa, Phoenix, Denver, Seattle, Las Vegas, Dallas, and Portland are the seven. Two or three consecutive prints turning them positive would mean the dispersion was noise around a national trend rather than a correction rolling across the map, and the second section loses its base.
Builders stop discounting into volume. Price cuts falling below roughly 30% of builders and incentives below 60%, with new-home volume holding, would mean demand recovered at sticker price and the capitulation read was simply wrong. This is the one already flickering, on the builders' own evidence: Lennar calls its incentive gap narrowing for the first time in three years, and D.R. Horton beat its margin guidance partly by pulling incentives back. What would convert a flicker into a falsification is the level following the direction, and at roughly 12.9% of sales price against a 4% to 6% norm it has a long way to travel.
Sales break out of the band. Existing sales have been pinned around 4.0 to 4.1 million. A decisive move above that with the median intact means sellers won the standoff, buyers met them there, and the frozen-transaction critique of the median stops mattering.
The repeat-sales indices re-accelerate while the median decelerates. That is the exact inverse of the mix argument in the first section. If it happens, the mix argument was backwards, and we would say so.
Four of the five did not happen this month, and the third has only started to move. What happened is that the median rose 2.0%, seven of nineteen metros fell, builders cut prices for the sixteenth month running, starts dropped 13.5%, and mortgage rates finished higher than a year ago against a $200 billion intervention designed to do the opposite. Those are all the same market. Only one of them was in the headline.
The releases this is built on
- NARExisting-home sales, July 2026The $434,100 median, the 4.06M sales rate, and the four regional mediansAug 11, 2026
- S&PS&P Cotality Case-Shiller Home Price Indices, May 2026National +1.1%; the nineteen-metro panel and its seven negativesJul 28, 2026
- CensusNew residential construction, July 2026Starts at 1.239M and completions at 1.212M against permits at 1.443MAug 18, 2026
- CensusNew residential sales, June 2026The $398,300 new-home median and 9.3 months of supplyJul 24, 2026
- NAHBHousing Market Index, August 2026HMI 35, sixteen months below 40, and the price-cut and incentive sharesAug 17, 2026
- NAHBCost of Housing Index, first quarter 202632% of median family income for a median-priced home, 65% at half that incomeMay 21, 2026
- LENLennar second quarter 2026 resultsIncentives at 12.9% of sales price; gross margin down to 15.6% from 17.8%Jun 11, 2026
- DHID.R. Horton fiscal 2026 third quarter resultsOrders flat at 23,084 homes, closings up 4%, cancellation rate 20%Jul 21, 2026
- HDHome Depot second quarter 2026 earningsUS comparable sales up 1.3%, and the smaller-projects demand lineAug 18, 2026
- LOWLowe's second quarter 2026 sales and earningsComparable sales up 0.2% and a full-year outlook cut to about flatAug 19, 2026
- FreddiePrimary Mortgage Market Survey30-year fixed at 6.67%, against 6.58% a year earlierAug 13, 2026
- BLSConsumer Price Index, July 2026Up 3.4% year over year, core up 2.5%Aug 12, 2026
- BLSConsumer Price Index, May 2026The 4.2% print the real-terms arithmetic is measured againstJun 10, 2026
- NARProfile of Home Buyers and Sellers, 2025First-time buyers at 21% of the annual market, median age 40
- RedfinHousing affordability, June 2026Income needed at $109,796 against an estimated median household income of $87,599Aug 5, 2026
- RedfinMortgages above 6% now exceed mortgages below 3%The third-quarter 2025 crossover, 21.2% against 20.0%
- PressPulte confirms Fannie and Freddie will buy $200 billion of mortgage bondsSecondary reporting on the January 8 directive
Disclosure, again. Convexity builds research tools for public-market data. This note is analysis, not investment advice, and nothing in it is a recommendation to buy, sell, or short any security, fund, or property. The disclosure at the top bears repeating where Lowe's results are cited: a member of the Convexity team is a Lowe's employee and holds Lowe's stock through its employee stock purchase plan, which is both a position in and a relationship with a company named here. Beyond that, we hold no position in any company named and no relationship with any organization whose release is cited. Government and trade-association series revise, and the Census construction figures in particular are estimates published with confidence intervals, so several numbers above will read differently at the next release. Figures attributed to Realtor.com, Coldwell Banker, Advisor Perspectives, and Scotsman Guide are those outlets' work, retrieved 2026-08-19 and not independently reproduced here.