








Disclosure. Not investment advice, and nothing here is a recommendation to buy, sell or hold any security. A member of the Convexity team holds the SPDR S&P 500 ETF (SPY), which holds Halliburton, Diamondback Energy and Baker Hughes; no other position. Figures are from Halliburton's third-quarter release, Diamondback Energy's, Permian Resources' and Northern Oil and Gas's filings, the U.S. Energy Information Administration, the Federal Reserve Bank of Dallas's Energy Survey and the Baker Hughes rig count. Halliburton's October 20 call is quoted only where two independent transcripts, from Benzinga and Investing.com, carry the same words. Futures settlements are as published by Yahoo Finance, because CME Group's own pages refuse automated reads; twelve of them were checked against the holdings a listed oil fund published for the same day. The closing note lists what is our arithmetic. This note was drafted with Claude.
Oil is back above $100 a barrel. The U.S. Energy Information Administration's spot price for West Texas Intermediate at Cushing, Oklahoma, was $101.91 on October 14, the latest day the agency had published when this note was written, up 52% from $66.96 on February 27, the last trading day before the U.S. and Israeli strikes on Iran (our arithmetic). The November futures contract settled at $103.66 on October 19.
The old rule of the shale era says a price like that sends American drillers back to work. It has, but not by much. Baker Hughes counted 459 rigs drilling for oil in the United States in the week to October 16, as Reuters reported its release, against an average of 409 in February: 50 more, an increase of about 12% (our arithmetic). That is still fewer than in the first three months of 2025, when oil was about $72 and the count averaged about 483. U.S. crude output in July, the latest month the agency has published, was 13.95 million barrels a day, below the record of 13.995 million set in October 2025. And on October 20, Halliburton, the largest supplier of hydraulic fracturing in North America by its own account, reported North America revenue 5% lower than in the second quarter and set its early plan for 2027 on "a flat North America market."
The reason is in the price a new well actually earns. A rig hired this autumn drills wells that sell their oil over the following years, not this month, and the futures market prices those years far below $100. On October 19 the December 2026 contract settled at $98.54, December 2027 at $80.89, December 2028 at $73.53 and December 2029 at $68.73. Between February 27 and October 19, the first of those rose $34.81 and the last $6.93 (our arithmetic). One oil executive told the Dallas Fed's survey in September that "Companies must look at the steep backwardation and budget off of a $65 per barrel or $70 per barrel price."
So the hypothesis we started from, that $100 oil has bought no new drilling, is wrong as stated: drilling has risen. What the filings and the survey show is a response sized to the futures curve and to balance sheets, not to the spot price. The fastest barrels came first, from wells already drilled and from repairs to old ones; new rigs came later and in modest numbers; and the large public producers that pump most U.S. oil said they would send more of the extra cash to shareholders than to drilling. U.S. shale is drilling as if $100 oil won't last, which is what the futures market says too.
EIA daily spot prices; NYMEX settlements as published by Yahoo Finance; Baker Hughes' count as reported by Reuters; Halliburton's third-quarter release. The rig change is ours.
What $100 oil has bought so far
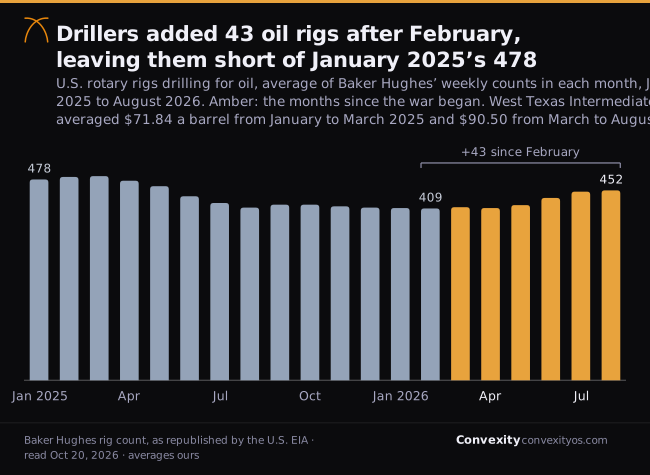
Start with the rigs, the measure most people watch. Baker Hughes counts the rotary rigs drilling in the United States every week, and the Energy Information Administration republishes the counts as monthly averages. Through 2025, as WTI fell from an average of $75.74 in January to $57.97 in December, the oil rig count fell from 478 to 411. It was 410 in January 2026 and 409 in February.
Then the war began, and for three months almost nothing happened. The count was 412 in March, when WTI averaged $91.38, 410 in April, when it averaged $100.32, and 417 in May, at $102.13. Only in June did it start to climb: 434 in June, 449 in July and 452 in August, the latest month the agency has published. That is 43 rigs, or 10.5%, above February (our arithmetic). The weekly count has moved little since: 459 in the week to October 16, down three from the week before, according to Reuters' account of the Baker Hughes release. The total U.S. count, including rigs drilling for natural gas, was 603 that week, 55 more than a year earlier, which is the figure Baker Hughes' own summary page shows.
A rig count is a blunt instrument, and it understates drilling more every year, because each rig drills more wells. Diamondback Energy, one of the largest producers in the Permian Basin of West Texas and New Mexico, told its shareholders in February that it drilled 463 wells in 2025 "utilizing an average of 15 drilling rigs," and that "Just two years ago, we would have needed around 22 rigs to drill that many wells." The Energy Information Administration's estimates for the Permian as a whole show the same thing: 1.56 new wells drilled per rig in January 2025 and 1.88 in September 2026. Over that span the region's rig count fell 11% and the number of wells drilled each month rose 7% (our arithmetic on the agency's figures).
So the better measure of drilling is wells, and on wells the response is clearer. The agency estimates that 436 new wells were drilled in the Permian in February and 506 in September, an increase of 16%. Wells completed, the fracturing work that turns a drilled hole into a producing one, rose from 458 to 492, or 7% (our arithmetic). Those estimates come with a warning the agency prints beside them: well reports arrive late, so the latest six months, April to September, are imputed rather than counted.
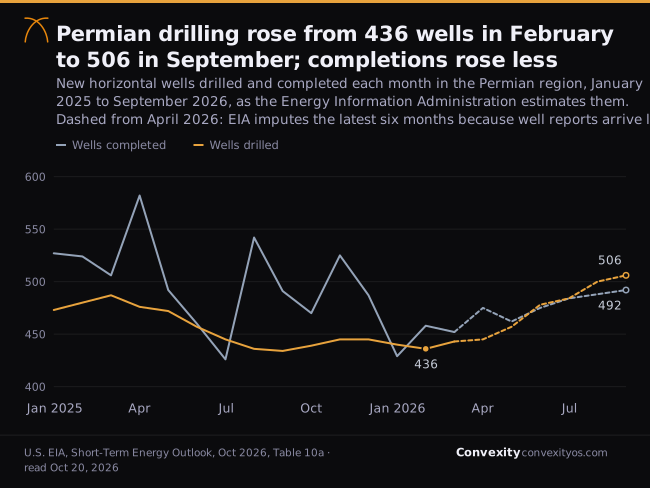
Against early 2025, the increase looks smaller still. In July to September 2026 the Permian drilled about 3% more wells a month than in January to March 2025, when oil averaged about $72, and completed about 6% fewer (our arithmetic on the agency's monthly figures). Since mid-year the region has drilled more wells than it has completed, so the stock of drilled but uncompleted wells, which fell from 1,358 in January 2025 to a low of 815 in May 2026, has begun to rebuild: 844 in September.
Production tells the same story more slowly. U.S. crude output was 13.948 million barrels a day in July, 224,000 barrels a day, or 1.6%, more than in July 2025 (our arithmetic). No month since October 2025's record of 13.995 million has passed it; April 2026 came closest, at 13.981 million. In its October outlook the Energy Information Administration expects 13.9 million a day on average in 2026 and 14.3 million in 2027. That last figure is the clearest sign that the outlook has changed: in February, before the strikes, the agency expected output to fall to 13.3 million in 2027. Between the two outlooks it raised its 2027 forecast by a million barrels a day, about 7% of last year's output (our arithmetic).
The price a new well actually earns
A futures contract fixes the price of oil delivered in a given month. When contracts for later months trade below those for nearer ones, as they do now, traders call the curve backwardated. It usually reflects a shortage today that the market expects to ease.
The curve has bent sharply since the war began. On February 27, every WTI contract from November 2026 to the end of 2030 settled between $61 and $65 a barrel; the market expected oil to stay in the low $60s for years. By October 19 the nearest contracts had risen far more than the distant ones.
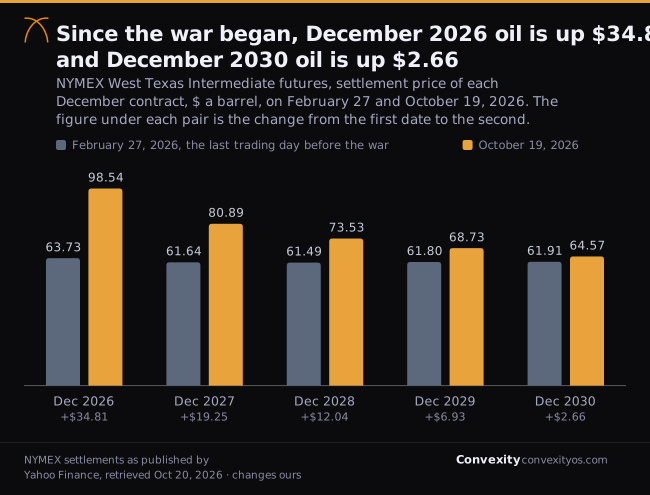
The November 2026 contract rose $39.52, or 62%, between the two dates. The twelve contracts for 2027 averaged $62.28 on February 27 and $87.97 on October 19; the twelve for 2028 averaged $61.42 and $76.32, a rise of 24% (our arithmetic). December 2030 rose $2.66. The market has priced a shortage that ends: December 2028 oil rose less than a third as much as the November contract (our arithmetic).
That matters because of when a new well sells its oil. A shale well takes months to drill, fracture and connect, and its output is heaviest early and falls fast after that. The Energy Information Administration's drilling figures show how fast: in September, on the agency's smoothed estimates, wells already producing in the Permian were losing about 487,000 barrels a day of output from one month to the next, and newly completed wells were adding about 488,000. A rig contracted this autumn is drilling for oil that will be sold largely in 2027 and 2028, at prices the market now sets near $88 and $76 on average, not $100.
Those prices still pay. In its March survey the Dallas Fed asked oil and gas executives what WTI price they need to drill a new well profitably. The average answer was $66 a barrel; $67 in the Permian; $59 for large firms producing at least 10,000 barrels a day. But in February, with every contract through 2030 near $61, below the $65 to $66 that executives told the Dallas Fed they needed in its 2025 and 2026 surveys, the industry had spent a year cutting rigs, not adding them. The question for a producer deciding whether to add rigs is how much the price of the oil those rigs will produce has risen, and for 2028 oil the answer is about a quarter, while the nearest contract rose by three-fifths.
The executives say as much. The Dallas Fed's September survey asked where they expect WTI to be. The average answer was $88 at the end of 2026, $79 two years out and $82 five years out, while spot WTI averaged $98.70 over the days the survey was collected, September 16 to 24. One exploration and production executive's comment, which the Dallas Fed published with the survey, described the arithmetic directly:
Companies must look at the steep backwardation and budget off of a $65 per barrel or $70 per barrel price while operating expenses per barrel and finding and development pricing is increasing quickly. Unnamed exploration and production executive, Dallas Fed Energy Survey, third quarter 2026
Another, from an oilfield services firm, asked the question this note is about: "What happens to the price if U.S. exploration and production firms do not respond to price signals?"
The Energy Information Administration's forecast is lower than the futures market's. Its October outlook expects WTI to fall through 2027 to $68 a barrel by December, averaging $80 for the year, below the $87.97 average of the 2027 futures (our arithmetic). It assumes "the majority of production in the region to return to pre-conflict averages by the end of 2Q27."
What the producers did with the windfall
Diamondback is the clearest case, because it said in advance what it would do. In February, before the war, it planned "to keep activity and production flat relative to our 4Q25 levels," with oil output of 500,000 to 510,000 barrels a day and capital spending of $3.6 billion to $3.9 billion. On May 4, with WTI above $100, it wrote to shareholders that "front month oil prices have increased by over 50% and the 2-year oil strip has moved by over 20%." The company's response came in that order of speed:
We have made the decision to begin to work down our drilled but uncompleted well (“DUC”) balance to maintain our current production level of over 520,000 Bo/d - up 3% from our original 2026 guidance. Diamondback Energy, letter to stockholders, May 4, 2026
It said it would run five completion crews for the rest of the year and "add two or three rigs to preserve a healthy backlog of projects." It raised its 2026 capital budget to about $3.90 billion from about $3.75 billion, an increase of $150 million, or 4% (our arithmetic). And it tested the plan against much lower prices: it "generates more Free Cash Flow per share in 2026 assuming WTI averages over $60 for the rest of the year."
The same letter said Diamondback would drop its commitment, in place since late 2021, to return a minimum share of each quarter's free cash flow to shareholders, because "The downside to the formulaic return mechanism was its restrictive structure on a highly cyclical business." By August the money was going to the balance sheet. Diamondback generated $2.3 billion of free cash flow in the second quarter alone, cut its total debt by about $1.3 billion in the quarter, left its capital budget at about $3.9 billion and doubled its share repurchase authorization to $16 billion. The year's added capital, $150 million, is about 6% of that one quarter's free cash flow (our arithmetic). "We expect to continue to prioritize debt reduction and use excess Free Cash Flow to improve the balance sheet," the August letter said.
Permian Resources, a large Delaware Basin producer, described a similar choice in its second-quarter release. "Our team executed a targeted response to higher oil prices, increasing capital expenditures to focus on high-return, rapid payback projects such as workovers," said Will Hickey, its co-chief executive. A workover is a repair to an existing well. It brings oil back quickly and does not require drilling a new one.
The Dallas Fed's surveys show the same split across the industry. In March, half of the exploration and production executives who answered said the number of wells they planned to drill in 2026 had not changed since the start of the year; among large firms, 69% said so. In September the survey asked where firms would put the extra cash flow they had earned in 2026. Among large producers, which the Dallas Fed says account for more than 80% of U.S. production, 50% chose returns to shareholders and 21% chose capital spending. Among small producers, capital spending came first, at 31%, followed by debt reduction at 23%. Asked about next year, 73% of exploration and production executives expected their capital spending to stay the same.
The drilling that has been added is coming disproportionately from smaller and private operators. Northern Oil and Gas, which owns minority stakes in wells that other companies operate, said on October 12 that "As oil strip prices have rallied, the Company has seen incremental acceleration of development activity across its oil basins." Halliburton's call on October 20 said where.
What Halliburton saw
Halliburton's third quarter was, in North America, a disappointment it partly chose. Revenue in the region was $2,160 million, 5.1% less than in the second quarter and 8.6% less than a year earlier; over nine months it was down 4.2% (our arithmetic on the release). The release put the decline down to "lower pressure pumping services in U.S. Land," pressure pumping being the industry's term for fracturing. Across the company, the Completion and Production division, which includes fracturing, lost $113 million of revenue, or 4%, on "lower stimulation activity in the Western Hemisphere," while Drilling and Evaluation gained $102 million, or 4%, partly from "increased drilling related services in the Western Hemisphere."
On the call, Shannon Slocum, executive vice president and chief operating officer, said the fracturing market "did not recover as strongly as anticipated." He also said part of the drop was Halliburton's doing: the company runs that business "for returns, not share," and in the quarter "moved several crews to new customers at better pricing." "These moves created more downtime than we anticipated," he said. Meanwhile its drilling services, drill bits and drilling fluids businesses in North America land grew 23% from a year earlier, "well ahead of the rig count."
The split between drilling and fracturing is what an analyst asked about. Arun Jayaram of J.P. Morgan said: "We have observed a pretty nice rebound in the rig count, yet completion activity has been quite measured." He added that "a lot of the rigs being picked up are by private E&Ps and not the publics." Slocum answered that "we see roughly 40 rigs being added in North America," and that private operators were adding fracturing work too. Asked later where the pricing cycle stood, he traced the conversations back to late in the second quarter, starting with private producers "being opportunistic of really where the strip was at that time," and with "some operators that have hedges." Halliburton's customers, he said, are "in the middle of their budget cycle."
That fits Halliburton's own numbers over the year. Its North America revenue was $2,136 million in the first quarter (our arithmetic, from the nine-month total), rose 6.6% to $2,276 million in the second, when producers such as Diamondback were fracturing their backlog of drilled wells, and fell to $2,160 million in the third. Fracturing the backlog was the quick response. Drilling new wells, which the Permian estimates show outpacing completions since mid-year, is the slower one, and the fracturing it implies is still to come.
Halliburton is not betting on it arriving soon. Jeff Miller, the chairman and chief executive, said in the release that the early outlook for 2027, mid-single-digit revenue growth and an operating margin of about 15%, "assumes a flat North America market and does not require any recovery in North America hydraulic fracturing. To us, that recovery is purely upside." He made the same point on the call and then qualified it. The flat North America in the plan, he said, is an assumption rather than a forecast: "That is not our view for North America." Slocum offered anecdotes of a tightening market, among them that the company "just had a big customer go in tender and only one service company showed up," and said he had seen indications in the past week that some of the larger operators were looking at their fracturing schedules for next year. For the fourth quarter, Eric Carre, the chief financial officer, guided to "steady frac activity in North America land."
So the most exposed company in the business sees the same thing the rig count and the survey show: drilling up, much of it by private operators; fracturing flat; and the large public producers still deciding.
What it means for U.S. supply
Put the pieces together and the U.S. response to $100 oil looks like this. The quick barrels came first, through completions of wells already drilled and repairs to old wells, and they arrived in the second quarter. New drilling started in June, about three months after the price spike, and is up by about a tenth on rigs and about a sixth on Permian wells. The large producers kept their budgets close to plan and paid down debt. Production has not set a new record, and the agency's forecast of 14.3 million barrels a day in 2027 implies growth of about 400,000 barrels a day over this year's average.
That is roughly what the industry said it would do. In June the Dallas Fed asked how much U.S. crude production would grow in 2027 if WTI held at $100. The most common answer was more than 250,000 but not more than 500,000 barrels a day, about 2% to 4% of 2025's output (our arithmetic). WTI has not held at $100 in the futures market, and the industry has planned accordingly.
For anyone hoping that American shale will bring the price down, that is the useful finding. The shale era's rule of thumb was that high prices cured themselves within a year or so, because drillers rushed in. The futures market is not counting on that this time. Its curve falls through 2027, the year in which the Energy Information Administration expects Middle East production to return, while the agency's own forecast has U.S. output growing about 3% next year (our arithmetic). The same disruption sets the jet fuel bill in our note on Delta Air Lines, and the agency expects gasoline, which averaged $4.35 a gallon in September, to average just under $3.60 in 2027 as the Middle East supply returns.
There is a reasonable case that this restraint is the right call for the producers. Oil that sells for $100 in November and $74 in December 2028 rewards whoever already has wells to finish, and punishes whoever commits to a long drilling program at the top. Diamondback's choice, completing what it had drilled and adding only enough rigs to rebuild the backlog, captures the first and avoids the second. Halliburton's 2027 outlook, which needs no fracturing recovery, is the same judgment seen from the supplier's side.
What would prove this wrong
This note argues that U.S. shale has responded to $100 oil modestly, that the response is sized to the futures curve and to balance sheets rather than to the spot price, and that the large public producers are the ones holding back. Each part can be checked against data with a date.
- The rig count. If the weekly oil rig count climbs well above the first quarter of 2025's average of about 483 before the end of the year while the December 2028 contract stays below about $75, drillers are answering the spot price, not the curve, and this note's central claim fails.
- The 2027 budgets. Large public producers set their 2027 plans in their fourth-quarter releases, mostly in February. If they raise spending well above 2026 levels and guide to production growth well beyond the Dallas Fed's typical answer, the discipline described here was a delay, not a choice. The Dallas Fed's fourth-quarter survey, due on December 16, will show whether expected spending for next year has moved.
- Fracturing. Halliburton guided to steady North America fracturing in the fourth quarter. If its fourth-quarter release, or Baker Hughes' and SLB's third-quarter results, which had not been published when this note was written, show fracturing activity rising quickly, the gap between drilling and completions is closing faster than this note assumes, and production will respond sooner.
- The Energy Information Administration's revisions. The Permian well counts for April to September are imputed. If the counted figures come in well above or below the estimates, the 16% increase in drilling since February moves with them. The agency's next outlook is due on November 10.
- The curve itself. If the later contracts rise, so that 2028 oil trades near today's spot price, and drilling still does not respond, the restraint is not about the curve at all; it is about payout commitments and balance sheets alone. If the later contracts fall further and drilling keeps rising, private operators are taking a bet the market is not.
The filings and documents this is built on
- 8-KHalliburton, third quarter 2026 earnings release (Exhibit 99.1)North America and segment revenue, the nine-month totals, the 2027 outlook and its flat North America assumptionOct 20, 2026
- CallHalliburton third quarter 2026 earnings call, transcript published by BenzingaOne of two independent transcripts; every call quotation appears in both, and speakers are named from the investor relations introductionOct 20, 2026
- CallHalliburton third quarter 2026 earnings call, transcript published by Investing.comThe second transcript; read in a browser, retrieved 2026-10-20Oct 20, 2026
- 8-KDiamondback Energy, letter to stockholders for the fourth quarter of 2025 (Exhibit 99.2)The pre-war plan to hold activity and production flat, the 2026 guidance, and 463 wells drilled with 15 rigs in 2025Feb 23, 2026
- 8-KDiamondback Energy, first quarter 2026 release and letter to stockholders (Exhibits 99.1 and 99.2)The front-month and two-year strip moves, the decision to work down drilled but uncompleted wells, the raised oil and capital guidance, and the end of the formulaic return of capitalMay 4, 2026
- 8-KDiamondback Energy, second quarter 2026 release and letter to stockholders (Exhibits 99.1 and 99.2)Second-quarter free cash flow and debt reduction, the unchanged capital budget, the doubled repurchase authorizationAug 3, 2026
- 8-KPermian Resources, second quarter 2026 results (Exhibit 99.1)The co-chief executive on rapid-payback projects such as workoversAug 5, 2026
- 8-KNorthern Oil and Gas, third quarter operational update (Exhibit 99.1)Acceleration of development activity as oil strip prices ralliedOct 12, 2026
- SurveyFederal Reserve Bank of Dallas, Dallas Fed Energy Survey, third quarter 2026Price expectations, the spot price during collection, where large and small producers will put extra cash flow, expected capital spending, and executives’ commentsSep 30, 2026
- SurveyFederal Reserve Bank of Dallas, Dallas Fed Energy Survey, second quarter 2026Expected 2027 U.S. production growth if WTI holds at $100Jun 24, 2026
- SurveyFederal Reserve Bank of Dallas, Dallas Fed Energy Survey, first quarter 2026Break-even prices to drill a new well, and 2026 drilling plans after the price riseMar 25, 2026
- ReportU.S. Energy Information Administration, Short-Term Energy Outlook, October 2026U.S. production and WTI forecasts, Table 10a drilling productivity estimates for the Permian region, and the Middle East assumptions; read 2026-10-20Oct 6, 2026
- ReportU.S. Energy Information Administration, Short-Term Energy Outlook, February 2026The pre-war forecast of U.S. crude production for 2027Feb 10, 2026
- DataU.S. Energy Information Administration, Cushing, OK WTI spot price FOB, dailyDaily spot prices through October 14, 2026; read 2026-10-20Oct 15, 2026
- DataU.S. Energy Information Administration, Crude Oil and Natural Gas Drilling Activity, monthlyBaker Hughes oil rig counts as monthly averages, January 2025 to August 2026; read 2026-10-20Sep 30, 2026
- DataU.S. Energy Information Administration, U.S. field production of crude oil, monthlyMonthly output through July 2026; read 2026-10-20Sep 30, 2026
- DataBaker Hughes, Rig Count overviewThe U.S. total of 603 for the week to October 16 and the change from a year earlier; read in a browser, retrieved 2026-10-20Oct 16, 2026
- ReportReuters, US energy firms left the rig count unchanged this week, Baker Hughes says, as published by BOE ReportThe weekly oil rig count of 459, which Baker Hughes publishes in a workbook we did not download; retrieved 2026-10-20Oct 16, 2026
- PricesNYMEX WTI futures settlement prices, as published by Yahoo FinanceDaily settlements for each contract month, November 2026 to December 2030, on February 27 and October 19, 2026; retrieved 2026-10-20Oct 19, 2026
- HoldingsUnited States 12 Month Oil Fund (USL), daily holdingsFutures prices for December 2026 to November 2027 as of October 19, used to check the Yahoo Finance series; retrieved 2026-10-20Oct 19, 2026
Not investment advice. This note is an analysis of company filings, an earnings call, official energy statistics and a Federal Reserve survey, published for research purposes, and not a recommendation to buy, sell or hold any security. A member of the Convexity team holds SPY, which holds Halliburton, Diamondback Energy and Baker Hughes; no other position.
What here is ours rather than theirs. As filed or stated by the companies: every revenue, capital, production, free cash flow, debt, well and rig figure attributed to Halliburton, Diamondback Energy, Permian Resources or Northern Oil and Gas, and every quotation of a company or its executives, which is from their filings or, for Halliburton's call, from wording both transcripts carry. As published by the Energy Information Administration: the spot prices, the monthly rig counts it republishes from Baker Hughes, U.S. production, the Permian well, rig and uncompleted-well estimates, its forecasts and the sentence quoted from its outlook. As published by the Federal Reserve Bank of Dallas: every survey result and executive comment. As published by Baker Hughes and reported by Reuters: the weekly rig counts. As published by Yahoo Finance: the futures settlements, twelve of which were checked against the USL fund's published holdings. Ours: the 52% rise in spot oil; the 50-rig and 12% increase in the weekly count against February's average, the 43-rig and 10.5% increase in the monthly count, and the first-quarter 2025 average of about 483 rigs and about $72 oil; the oil-price averages in the rig chart; every change in a futures price, the 2027 and 2028 calendar-year averages and their percentage changes, and the comparison of the December 2028 and November 2026 increases; the Permian changes in rigs, wells drilled and wells completed, the comparisons with early 2025 and the low in uncompleted wells; the 224,000-barrel and 1.6% rise in production, the million-barrel revision to the 2027 forecast and its share of output, and the implied 400,000 barrels a day, or about 3%, of growth; the share of 2025 output the Dallas Fed's typical answer represents; the average of the agency's 2027 price forecast; Halliburton's first-quarter North America revenue by subtraction and every percentage change in its revenue; and Diamondback's 4% budget increase and its share of one quarter's free cash flow.