








Disclosure. Not investment advice, and nothing here is a recommendation to buy, sell or hold gold or any security. This note is about the gold price, and a member of the Convexity team owns physical gold and stands to benefit if its price rises, so we are not neutral on the subject. The same team member holds the SPDR S&P 500 ETF (SPY), which holds Newmont, a gold miner, at under 0.2% of the fund; no position in gold funds or other gold miners, and no other position. Gold prices are the LBMA afternoon benchmark as the World Gold Council publishes it, yields are the U.S. Treasury's own published curves, gold flows are the World Gold Council's estimates and futures positions are the CFTC's reports; gold prices and Treasury yields run to October 23, 2026, other series to the last day each had published, as dated, and the closing note lists what is our arithmetic. This note was drafted with Claude.
On Friday, February 27, the afternoon gold auction in London set the price of an ounce at $5,222.30. Early the next morning, at 1:15 a.m. Eastern time, U.S. Central Command says "U.S. and partner forces began striking targets" in Iran. On Friday, October 23, the same auction set gold at $4,013.30, 23.2% lower. In those nearly eight months Brent crude went from $71.32 a barrel to as high as $138.21, U.S. consumer prices rose 3.7% in the year to September, regular gasoline passed $4 a gallon, and the Federal Reserve raised interest rates for the first time since 2023.
Gold is supposed to rise in wars and in inflation, and 2026 has had both. The explanation that fits the data is that the war did not make gold more valuable to own; it made gold more expensive to hold. Gold pays no interest, so the cost of owning it is the return its owner gives up, and the cleanest measure of that return is the real yield: what a 10-year Treasury inflation-protected security pays above inflation. It was 1.72% on February 27, its lowest of the year, and 2.66% on October 23. On October 5 it reached 2.95%, a level it had not touched since November 2008.
Until early October, that explanation was right about the direction and the timing and incomplete about the size. Each of the three stretches in which gold fell between the strikes and the real yield's peak on October 5 coincided with a rise of 28 to 53 basis points (hundredths of a percentage point) in the real yield, and the one rebound came in the weeks it barely moved. But on gold's 2008 to 2021 relationship with the real yield and the dollar, the moves from February to mid-October would account for a fall of about 7%, not 20% (our arithmetic). The rest, this note argues, is what the war did to a bet. Gold was bid to a record in January partly on the expectation of cheaper money, rate cuts and a more accommodating Fed, and the war delivered the opposite. Since the peak, the explanation has stopped working. In the nearly three weeks to October 23 the real yield came down 29 basis points, about as far as it rose in the first month of the war, and gold fell another 3.1%. A link that held on the way down and fails on the way back is a weaker claim than the one this note set out to make, and the sections below say how much weaker.
What follows sets out the facts from the benchmark price, measures the fall against the real yield stretch by stretch, looks at the September inflation report and the bond rally that followed it, measures how much the real yield explains, looks at who bought and who sold, tests the other explanations (the dollar, a January bubble, central banks, a scramble for cash) and names what would prove the argument wrong.
LBMA Gold Price PM as published by the World Gold Council; U.S. Treasury daily real and par yield curves; FRED 10-year breakeven inflation rate; World Gold Council, Gold Demand Trends Q2 2026. The percentage change and the breakeven change are our arithmetic on the published figures.
The price, measured on one benchmark
Coverage of gold this year has printed several different peaks, because it measures several different things. VanEck, which manages gold funds, put the intraday high on January 29 at $5,595 an ounce. Futures settlements differ again. This note uses one series throughout: the LBMA Gold Price, set by auction in London twice each business day, at its afternoon (PM) auction, as the World Gold Council publishes it. On that measure the record was $5,405.00 on January 29, the same "historical high of US$5,405/oz" the Council cites in its first-quarter report. The World Bank's monthly averages, which switched to a spot price in June 2025, tell the same story at lower resolution: February 2026 was the highest month on record at $5,020, and September averaged $4,319.
Gold rose 23.7% from December 30, 2025 to the January 29 record. It then fell 7.8% at the next day's auction, the largest one-day fall in the afternoon price since April 15, 2013 (our count, over the series from 2003), and reached $4,714.75 on February 2. By February 27 it had climbed back to within 3.4% of the record, and on March 2, the first auction after the strikes, it was $5,313.90, up 1.8% on the Friday. From there it fell to $3,993.55 on July 16, 26.1% below the record, rebounded to $4,562.75 on August 28, fell to $4,089.25 on October 14, the day of the September inflation report, and was $4,013.30 on October 23, its lowest since July 29.
How large that fall is depends on where the count starts. From the record it is 25.7%. From the last auction before the strikes it is 23.2%, and from the first auction after them, 24.5%. Gold on October 23 was also 8.1% below where it started the year, and 3.1% below its price a year earlier, on October 23, 2025. The war has taken back everything gold gained in 2026 and the last ten weeks of 2025 with it. It has not undone the bull market before that: the price is still 46.7% above its level two years earlier, on October 23, 2024.
A war that raised the price of money
The war's economic effect ran through oil. Brent, which the Energy Information Administration recorded at $71.32 on February 27, peaked at $138.21 on April 7, was $135.51 on October 2 and $126.55 on October 14, and fell to $115.22 on October 20, the last day it had published when this was written. The EIA's weekly survey put regular gasoline at $4.284 a gallon on October 19, against $2.937 in the week of February 23; its highest October reading before this year was $3.912, in 2022. Consumer prices followed the fuel. The Bureau of Labor Statistics reported on October 14 that the all items index rose 3.7% in the year to September, up from 3.4% in the year to August, and that "The energy index increased 20.4 percent for the 12 months ending September." Prices excluding food and energy rose 2.6%.
That split matters for gold. This was an energy shock on top of core inflation of 2.6%, and the Fed treated it as something to fight rather than look through. In January it held its target range at 3.5% to 3.75%, with two governors dissenting in favor of a cut. In March it added one sentence: "The implications of developments in the Middle East for the U.S. economy are uncertain." Kevin Warsh, whom the president formally nominated on March 4, took the oath as chairman on May 22. The first statement under him, on June 17, said "Inflation remains elevated relative to the Committee's 2 percent goal, in part reflecting supply shocks that have driven price increases in certain sectors, including energy." It closed that paragraph with a new sentence, "The Committee will deliver price stability.", which every statement since has repeated. In July three members dissented in favor of a hike. On September 16 the Committee raised the range to 3.75% to 4%, saying "Today's policy action will support a timelier return to the Committee's 2 percent goal." It meets next on October 27 and 28.
The bond market had moved first. The 2-year Treasury yield, a fair read of where traders expect the Fed's rate to be over the next two years, was 3.38% on February 27, below the Fed's range at the time, which is how a market prices cuts. On October 23 it was 4.69%, above the range after the hike, which is how a market prices more hikes. The 10-year yield rose from 3.97% to 5.00%, and almost all of that, 94 of 103 basis points, was the real yield. The rest is the 10-year breakeven, the gap between the ordinary and the inflation-protected yield, which is the bond market's estimate of average inflation over the decade. It went from 2.25% to 2.34%, and all year it has stayed between 2.18% and 2.50%, including through the day a 3.7% inflation report came out.
That is the combination in which gold does worst. An inflation hedge pays when investors fear inflation that the central bank will not control. The bond market priced the opposite: a temporary energy shock and a central bank willing to raise the real return on money until it passed. Holding an ounce of gold for ten years instead of the inflation-protected bond meant forgoing 1.72% a year above inflation on February 27, and 2.66% on October 23. In money: $100,000 put into the 10-year inflation-protected note on February 27 locked in about $1,720 a year above inflation, and the same sum on October 23 about $2,660, or $2,950 at the October 5 peak (our arithmetic). Gold earns nothing, so that is the yearly price of holding it instead, and it rose by about 55% in nearly eight months. Our note on the long end followed the same repricing through the hyperscalers' bonds, and our Lennar note found the 30-year mortgage rate bottomed in the same week of February.
Stretch by stretch
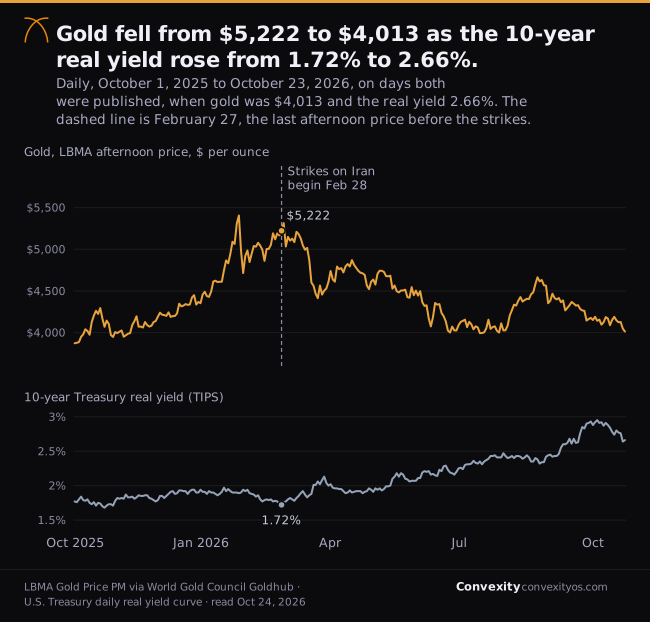
The chart shows the two series moving together after February and apart before it. The table breaks the year into its eight stretches.
| Stretch | Gold, start to end | Gold | 10-year real yield | Broad dollar |
|---|---|---|---|---|
| January run, Dec 30 to Jan 29 | $4,367.80 to $5,405.00 | +23.7% | −1bp | −1.7% |
| Warsh named, Jan 29 to Feb 2 | $5,405.00 to $4,714.75 | −12.8% | +5bp | +0.8% |
| Into the strikes, Feb 2 to Feb 27 | $4,714.75 to $5,222.30 | +10.8% | −22bp | −0.5% |
| First month of war, Feb 27 to Mar 31 | $5,222.30 to $4,608.35 | −11.8% | +28bp | +2.7% |
| To the July low, Mar 31 to Jul 16 | $4,608.35 to $3,993.55 | −13.3% | +35bp | −0.6% |
| Summer rebound, Jul 16 to Aug 28 | $3,993.55 to $4,562.75 | +14.3% | +7bp | −1.3% |
| Into the hike, Aug 28 to Oct 5 | $4,562.75 to $4,141.65 | −9.2% | +53bp | +2.1% |
| The real yield eases, Oct 5 to Oct 23 | $4,141.65 to $4,013.30 | −3.1% | −29bp | +0.1% |
Gold is the LBMA afternoon price; the real yield is from the Treasury's real yield curve; the dollar is the Federal Reserve's nominal broad index, whose last published day is October 16, so the final stretch ends there for the dollar. Every change is our arithmetic.
The first two stretches have nothing to do with real yields. Gold rose 23.7% in January while the real yield fell by a hundredth of a point. The World Gold Council recorded US$19 billion of inflows to gold exchange-traded funds that month, the strongest on record, and record trading volume, and wrote that "Prices had become stretched through January". VanEck described the break above $5,000 as having appeared "to unleash a wave of speculative buying." Then, on news of Warsh's nomination, gold lost 12.8% in two auctions while the real yield rose five hundredths of a point: a verdict on the next chairman rather than on that week's yields. The third fits the textbook: through February gold climbed back as tension with Iran built and the real yield fell 22 basis points to its low for the year. Before the war, gold did what a haven is supposed to do.
After the strikes the pattern changed. In each of the three stretches in which gold fell between the strikes and the October 5 peak, the real yield rose, by 28 to 53 basis points. In the one stretch in which gold rose, from mid-July to late August, the real yield rose by 7. The World Gold Council attributed the August rally to other forces: U.S. intervention to support the yen at the end of July, an intervention by the U.S. Treasury on August 19 that revived fears of dollar debasement, and momentum. When the real yield held still, those forces moved gold. When it rose sharply, as it did in September and into October, they did not hold it up. The Council's own model, which splits gold's return among its drivers, reached the same verdict on September, when the afternoon price fell 8.5%: "soaring US Treasury yields amid the Fed's tightening moves and the strengthening dollar weighed on gold."
The last row breaks the pattern. It is the first test the argument has faced in the other direction, and in it the real yield fell and gold fell too.
The first test in the other direction
The real yield peaked at 2.95% on October 5. Three things happened in the weeks after that, and the argument here makes a prediction about each.
The first was the September consumer price report, released at 8:30 a.m. Eastern time on Wednesday, October 14. Prices rose 0.6% in the month and 3.7% over the year, and in the Bureau of Labor Statistics' words gasoline accounted "for over half of the monthly all items increase." Ninety minutes later the London afternoon auction set gold at $4,089.25, down 1.9% on the day and its lowest since August 4. The 2-year yield closed 3 basis points higher, the market pricing a little more of the Fed. But the 10-year real yield closed the day 4 basis points lower, and the breakeven moved only from 2.33% to 2.35%. On the daily data, then, gold fell on an inflation report without the real yield rising. Daily data cannot settle why. The auction is at 10 a.m. in New York and the Treasury's curves are read in the afternoon, and what yields did between the two is in neither series.
The second was a sell-off in technology shares. In the week to Friday, October 16, the Nasdaq Composite fell 4.5% and the S&P 500 1.9%, and money moved into Treasuries. The 10-year real yield fell 17 basis points in the week, to 2.74%, its largest weekly fall since a fall of the same size in April 2025, and the 2-year fell 6. On the sensitivity gold has shown since the strikes, set out in the next section, a fall that size was worth a rise of about 2.2% (our arithmetic). Gold rose 0.1%. The dollar did not stand in the way: the Federal Reserve's broad index fell 0.2% that week. The World Gold Council, in its weekly market note on October 19, called the bond rally a "mixed message" for gold: Treasuries were competing for the money looking for safety, even as lower yields cut the cost of holding gold.
The third was a week in which the two moved the same way. In the week to Friday, October 23, the real yield eased another 8 basis points, to 2.66%, and gold fell 4.2%, to $4,013.30, its lowest since July 29. The largest single fall came on Thursday, October 22, when the real yield fell 12 basis points and the afternoon auction set gold 1.9% lower. On the 2026 sensitivity an 8 basis point fall was worth a rise of about 1.0% (our arithmetic). The CFTC's report for October 20 shows money managers still cutting their net long positions on COMEX, and the Federal Reserve's broad dollar index for the week had not been published when this was written.
Across the nearly three weeks from the October 5 peak to October 23, the real yield fell 29 basis points and gold fell 3.1%. Three weeks are short against seven months, and the relationship was loose even while it worked: since February, the real yield has accounted for about an eighth of gold's weekly moves. But this is the first stretch since the strikes in which the real yield fell by a meaningful amount, and gold moved the wrong way. If the argument here is right that the war broke a bet on cheap money, relief on that scale would not be expected to rebuild the bet quickly, and a slow response would be consistent with it. A further fall is harder to square. It is what the early stage of the argument being wrong would look like, and the last section says how far it would have to go.
How much the real yield explains
The textbook relationship can be measured. We compared weekly changes in the gold price with weekly changes in the 10-year real yield, taking in each week the last day on which both were published (our regression). That asks a narrow question: in the weeks the real yield rose, how much did gold tend to fall, and how reliably? It works on changes rather than levels, so a long drift in either series cannot flatter the result, and weekly rather than daily changes keep the gap between London's afternoon auction and New York's close from blurring it. From 2008 to 2021, gold tended to fall about 5.5% for each percentage point the real yield rose, a real but loose relationship that accounted for about 6% of the week-to-week variation. From 2022 to 2025 it nearly vanished: about 3.3% per point. Measured from the end of 2021 to the end of 2025, gold rose 141.9% while the real yield climbed from −1.06% to 1.90%, which is the opposite of the textbook. The explanation usually given is central bank buying, which the Council puts at 178 to 226 tonnes a quarter through the last three quarters of 2025, and which reserve managers responding to its survey describe in terms of diversification and protection against geopolitical risk rather than yield.
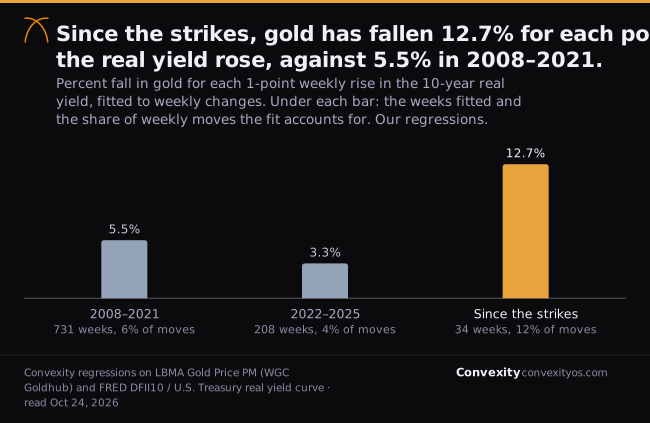
Since February 27 the relationship has come back at more than twice its old strength: about 12.7% for each point over the 34 weeks to October 23, accounting for about 12% of the weekly variation. Leaving out March, the month of the scramble for cash described below, it is 10.2%. The estimate is not stable, which is itself worth knowing. Through the week to October 9 it stood at 17.7%. The week of the bond rally, in which the real yield fell and gold did not rise, took it to 15.1%, and the week to October 23, in which both fell, to 12.7%. Applied the other way, the 2008 to 2021 relationship, with the dollar included, says the moves from February 27 to October 16, the last week of the dollar index published when this was written (a real yield up 1.02 points and a dollar up 3.0%), should have cost gold about 6.6%. It lost 19.8% over those dates.
So real yields explain the direction and the timing of the fall from the strikes to October 5, and on the old relationship roughly a third of its size. The rest needs an account of why gold became so much more sensitive to the price of money in 2026 than it had been for years, and why the sensitivity has worked on the way down and not, so far, on the way back.
Who sold, and who kept buying
The account starts with who owned gold at the top. Global gold ETF holdings reached a record 4,176 tonnes on February 27, the day before the strikes, according to the World Gold Council. Bar and coin buying had run at 428 tonnes in the fourth quarter of 2025 and 477 in the first quarter of 2026, a level the Council called exceptional. Investors, in other words, were the marginal buyers, and the Council's own commentaries say what many of them were betting on. In January it cited "investor expectations of eventual rate cuts" alongside doubts about the Fed's independence. In February it listed "A more favourable opportunity cost for holding gold, driven by dollar weakness and lower rates".
The war removed that premise within weeks. In March, global gold ETFs lost US$12 billion, the largest monthly outflow on record, and North American funds US$13 billion. The Council's explanation was a broad risk-off move that "likely prompted US investors to raise liquidity by selling prior winners such as gold", trend-following funds amplifying the slide, and "rate expectations shifted materially from potential cuts in 2026 to rates now expected to remain unchanged through September 2027". In June, holdings fell another 74 tonnes, and the Council named hawkish signals from the new chairman, inflation fears from the conflict, rising real yields and a stronger dollar.
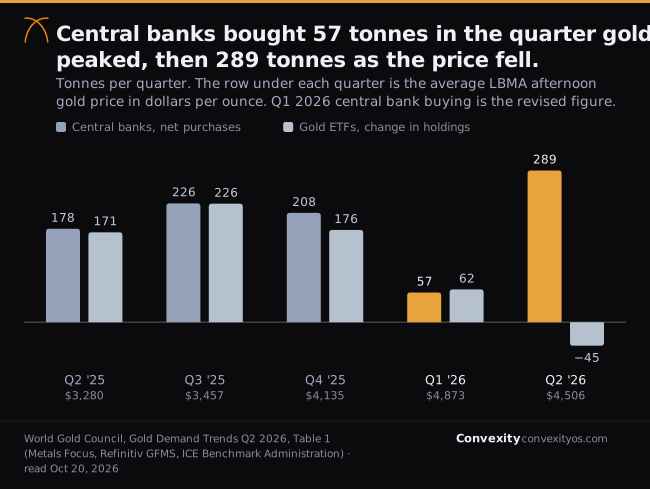
Central banks behaved the other way round. In the first quarter, the one containing both the record and the first month of war, they bought a net 57 tonnes. The Council first published 244 and revised it in July, moving 187 tonnes to over-the-counter demand, and it says the first half was weighed down by "hefty Q1 selling by Turkey, Russia and Azerbaijan". In the second quarter, as the average price fell 7.5%, they bought 289 tonnes, a record for a second quarter, led by Poland's 51 and China's 33. The buyers least concerned with yield stepped back at the top and came back on the way down. They were not enough to stop the price falling another 13.3% between March 31 and July 16. The purchases central banks report themselves, which the Council collects from the IMF and the banks and which capture only part of what its quarterly estimates include, show the buying continuing into the third quarter: a net 23 tonnes in July and 39 in August, led by China, Uzbekistan and Poland. The People's Bank of China then reported adding 23 tonnes in September, its largest monthly addition since October 2023.
Nor was the other large buyer the Council can only estimate. Its over-the-counter category, which captures large private purchases it cannot observe directly as well as any statistical residual, came to 327 tonnes in the second quarter, and it reports that "much of the OTC buying was concentrated among Asian markets". Set against those purchases, the visible selling in the second quarter was narrow: North American funds lost 45 tonnes, as much as the world's net ETF decline, and the Council names the falling price itself and a higher opportunity cost of holding gold as the reasons.
The third quarter complicates the picture in a useful way. ETF holdings rose 211 tonnes in the quarter to a record 4,256 tonnes at the end of September, even as the price fell after the hike, and the Council's weekly figures show another 22.5 tonnes added by October 16, a new record of 4,279 tonnes. Of September, the Council wrote: "These developments increased the opportunity cost of holding gold and weighed on its price." But the selling it recorded that month came from futures: money managers cut their net long positions on COMEX by 84 tonnes, to 387, having added 96 in August. The CFTC's reports since show them cutting another 48.9 tonnes, to 338.0 on October 20 (our conversion of the CFTC's contract counts, which reproduces the Council's September figures). The investors who own gold outright kept buying. On our reading, the traders who hold it for weeks, the most rate-sensitive money in the market, drove both the August rally and the September fall: a fund holding gold on borrowed money, or measured against cash returns every month, feels a higher real yield first. Their continued selling into late October, while the real yield came off its peak, is one candidate for why gold did not follow it back up.
The other explanations, tested
The dollar. Gold is priced in dollars, so a stronger dollar makes it dearer for everyone else. The Federal Reserve's broad dollar index rose 3.0% between February 27 and October 16, the last day in its weekly release before this note was written. On the 2008 to 2021 relationship that accounts for 3.8 points, more than half, of the 6.6% described above. It is part of the story, and a small part.
A January bubble. The January run had the marks of one: a 23.7% rise in a month with real yields flat, record inflows, record volume and a 12.8% collapse on one piece of news. But gold had recovered to within 3.4% of its record by the eve of the strikes, so the fall since then is not a bubble deflating before the war. What is true is that the level the war started from contained the whole of 2026's gain, 19.6% from December 30 to February 27, and the war has removed all of it. The premium built on cheap money was the part most exposed to dear money.
Central bank selling. It mattered in the first quarter, when Turkey, Russia and Azerbaijan sold. It cannot explain the second quarter, when central banks bought at a record pace for the season and the price fell anyway, and the purchases they report show net buying through August, with Turkey buying again in August after three months of sales and Russia still selling. The Council's estimate for the third quarter as a whole comes with its next Gold Demand Trends.
A scramble for cash. March looked like one. Gold can fall in the first weeks of a shock because it is easy to sell, as it did in 2020: from March 6 to March 19 of that year, the afternoon price fell 12.4%, and by April 15 it was above where it had started. In 2026 it fell 16.9% from March 2 to March 24, and instead of recovering it kept falling, to $3,993.55 on July 16. A scramble for cash explains how fast March went, not the six months after it. The sell-off in technology shares in the week to October 16 was a smaller test of the same idea, and gold neither fell with shares nor rose with Treasuries.
Weak physical demand. Jewellery consumption fell to 278 tonnes in the second quarter, its lowest since the pandemic, according to the Council. That is a response to high prices rather than a cause of low ones: jewellery volumes fell 23% from a year earlier in the first quarter, when the price was setting records, and 17% in the second. It is not what moved the price in 2026.
The case against this note
There are four serious objections.
The first is circularity. The 12.7% sensitivity is estimated from the same 34 weeks it is used to explain, so saying that real yields explain the fall because gold has been unusually sensitive to them this year comes close to restating the fall. It is also fragile: the last two weeks moved it by 5.0 points. The evidence that does not lean on it is thinner: the stretch-by-stretch timing, the flow data and the Council's own attributions. On the 2008 to 2021 relationship alone, real yields and the dollar explain about a third.
The second is common cause. The war moved oil, inflation, the Fed, the real yield and investors' appetite for risk all at once. On a day of escalation, gold could fall because traders sold winners to cover losses elsewhere and the real yield could rise because inflation fears rose, with neither causing the other. Weekly data cannot separate those.
The third is the third quarter. If a higher real yield drives gold down by raising the cost of holding it, the people paying that cost should sell. Instead ETF investors, the most visible owners, added 211 tonnes in the third quarter and 22.5 more in the first half of October, taking holdings to a record, while the real yield rose to its highest since 2008. The mechanism this note describes worked through futures traders, not through owners.
The fourth is the three weeks since the real yield peaked, in which it fell 29 basis points and gold fell with it. A link that works only one way is a weaker claim than the one this note started with, and the latest week, in which both fell, moves the real yield toward describing the fall rather than explaining it.
We accept the first two as limits on how strongly the case can be stated, the third as a refinement of it (the real yield sets gold's price through the money that trades it, not the money that holds it), and the fourth as the test now under way, which the argument is so far failing. What the data does not support is the story that gold fell because the war was less frightening than it looked. The haven bid arrived before the strikes and was paid in full by March 2.
What would prove this wrong
- The real yield falls and gold does not follow. If the 10-year real yield returns below 2.4%, roughly where it stood in August, and gold stays below $4,300 for a month after, the link this note relies on is weaker than it looks. The three weeks after the October 5 peak, a 29 basis point fall in which gold fell 3.1%, are the opening of this test, and it is going against the argument.
- Gold rallies with the real yield near its peak. A sustained rise in gold while the real yield holds at or above 2.66%, its level on October 23, would mean something other than the price of money is setting the price.
- Central banks turn seller. The World Gold Council's third-quarter Gold Demand Trends, expected in late October on the timing of last year's report (published October 30, 2025), will show whether official buying continued beyond what central banks report themselves. Net selling would make the official sector, not the real yield, the better account of the summer.
- Breakeven inflation breaks out with gold. The Fed meets next on October 27 and 28. If the 10-year breakeven rises above 2.5%, the top of its 2026 range, and gold rises with it, the market has stopped trusting the Fed to contain the shock, and gold's inflation-hedge role is back.
- Futures stop leading. If gold falls further while money managers' net long positions on COMEX rise, futures traders are not the marginal seller this note says they are.
A last reminder, given the subject: a member of the Convexity team owns physical gold and stands to benefit if its price rises. Nothing in this note suggests when, or whether, it will.
The data and documents this is built on
- DataLBMA Gold Price PM, US dollars, daily, as published on the World Gold Council GoldhubEvery gold price cited, 2003 to October 23, 2026; administrator ICE Benchmark Administration; quarterly averages match those in Gold Demand Trends; read 2026-10-24Oct 23, 2026
- DataU.S. Department of the Treasury, Daily Treasury Par Real Yield Curve RatesThe 10-year real yield, 2025 and 2026; read 2026-10-24Oct 23, 2026
- DataU.S. Department of the Treasury, Daily Treasury Par Yield Curve RatesThe 2-year and 10-year nominal yields, and with the real yield curve the 10-year breakeven after October 19; read 2026-10-24Oct 23, 2026
- DataFederal Reserve Bank of St. Louis, FRED, 10-Year Treasury Inflation-Indexed Security, Constant Maturity (DFII10)The real yield history from 2003 used for the weekly regressions and the November 2008 comparison; identical to the Treasury curve on every 2025 and 2026 date both carry; read 2026-10-20Oct 16, 2026
- DataFederal Reserve Bank of St. Louis, FRED, 10-Year Breakeven Inflation Rate (T10YIE)To October 19, 2026; FRED computes it as the Treasury's 10-year constant-maturity yield less its 10-year real yield, which matches on every 2026 day, so later days are taken from the Treasury's curves; read 2026-10-20Oct 19, 2026
- DataBoard of Governors of the Federal Reserve System, Nominal Broad U.S. Dollar Index, via FRED (DTWEXBGS)Last observation used, October 16, 2026; read 2026-10-20Oct 16, 2026
- DataNasdaq Composite Index (NASDAQCOM) and S&P 500 (SP500), daily closes, via FREDThe week to October 16, 2026; read 2026-10-20Oct 16, 2026
- DataU.S. Energy Information Administration, Europe Brent spot price FOB, dailyLast observation used, October 20, 2026; the April 7 peak dated from the same series via FRED (DCOILBRENTEU); read 2026-10-24Oct 20, 2026
- DataU.S. Energy Information Administration, US regular all formulations retail gasoline price, weeklyLast observation used, October 19, 2026; Octobers from 1990 for the 2022 comparison; read 2026-10-20Oct 19, 2026
- ReleaseBureau of Labor Statistics, Consumer Price Index, September 2026 (USDL-26-1574)All items up 0.6% in the month and 3.7% over 12 months, energy up 20.4%, all items less food and energy up 2.6%; gasoline over half of the monthly increase; released 8:30 a.m. ETOct 14, 2026
- FOMCFederal Reserve, FOMC statementTarget range held at 3-1/2 to 3-3/4 percent; two dissents in favor of a cutJan 28, 2026
- FOMCFederal Reserve, FOMC statementThe sentence on developments in the Middle EastMar 18, 2026
- FOMCFederal Reserve, FOMC statementInflation elevated in part from supply shocks including energyJun 17, 2026
- FOMCFederal Reserve, FOMC statementThree dissents in favor of raising the target rangeJul 29, 2026
- FOMCFederal Reserve, FOMC statementThe target range raised to 3-3/4 to 4 percentSep 16, 2026
- DataFederal Reserve Bank of St. Louis, FRED, Federal Funds Effective Rate (DFF)The rise on September 17, 2026 is the first since July 27, 2023; read 2026-10-20Oct 16, 2026
- ReleaseFederal Reserve, Kevin Warsh takes oath of office as chairmanNominated March 4, confirmed as chairman May 13, sworn in May 22May 22, 2026
- ReleaseU.S. Central Command, U.S. Forces Launch Operation Epic FuryStrikes began at 1:15 a.m. ET on February 28; read in a browser because scripted requests were refused; read 2026-10-20Feb 28, 2026
- ReportWorld Gold Council, Gold Demand Trends Q2 2026, executive summaryTable 1: central bank, ETF and bar and coin demand by quarter, and the LBMA quarterly averages; read 2026-10-20Jul 30, 2026
- ReportWorld Gold Council, Gold Demand Trends Q2 2026, central banksThe revision from 244t to 57t, the Q1 sellers, the Q2 buyers, and the reasons reserve managers give in the survey; read 2026-10-20Jul 30, 2026
- ReportWorld Gold Council, Gold Demand Trends Q2 2026, investmentBar and coin and OTC context, the June ETF outflow and its attribution; read 2026-10-20Jul 30, 2026
- ReportWorld Gold Council, Gold Demand Trends Q1 2026, executive summaryThe US$5,405 record, first-quarter jewellery volumes and the July erratum; read 2026-10-20Apr 2026
- ReportWorld Gold Council, Gold ETF Flows: January 2026Record January inflows and volume; the January rate-cut and Fed independence attributions; read 2026-10-20Feb 5, 2026
- ReportWorld Gold Council, Gold ETF Flows: February 2026The opportunity-cost attribution for February inflows; read 2026-10-20Mar 5, 2026
- ReportWorld Gold Council, Gold ETF Flows: March 2026The record March outflow and its attribution; read 2026-10-20Apr 8, 2026
- ReportWorld Gold Council, Gold ETF Flows: June 2026The 74t June outflow and its attribution; read 2026-10-20Jul 8, 2026
- ReportWorld Gold Council, Gold ETF Flows: July 2026The record holdings of 4,176t on February 27; read 2026-10-20Aug 6, 2026
- ReportWorld Gold Council, Gold ETF Flows: August 2026The August drivers and the 96t rise in money manager net longs; read 2026-10-20Sep 9, 2026
- ReportWorld Gold Council, Gold ETF Flows: September 2026Q3 holdings up 211t to a record 4,256t; money manager net longs down 84t to 387t, from CFTC data; read 2026-10-20Oct 7, 2026
- DataWorld Gold Council, gold ETF holdings and flows, weekly dataGlobal holdings by region to October 16, 2026 (Bloomberg, company filings, World Gold Council); summed by us; read 2026-10-20Oct 16, 2026
- DataCommodity Futures Trading Commission, Disaggregated Commitments of Traders, futures and options combined, COMEX goldManaged money long and short contracts, July 28 to October 20, 2026; converted to tonnes by us at 100 troy ounces a contract; read 2026-10-24Oct 20, 2026
- CommentaryWorld Gold Council, Central Bank Gold Statistics: Central banks make positive headlines on goldReported net buying of 23t in July; read 2026-10-20Sep 3, 2026
- CommentaryWorld Gold Council, Central Bank Gold Statistics: Central banks continue summer spree in AugustReported net buying of 39t in August, led by China, Uzbekistan and Poland; Turkey buying again, Russia selling; read 2026-10-20Oct 6, 2026
- CommentaryWorld Gold Council, China gold market update: Q3 ends with strong official gold buyingThe PBoC's 23t September addition; the September return attribution and the 8.5% fall in the LBMA PM price; read 2026-10-20Oct 15, 2026
- CommentaryWorld Gold Council, Weekly Markets Monitor: Bonds back in the roomThe Treasury rally during the Nasdaq sell-off and what it means for gold; read 2026-10-20Oct 19, 2026
- CommentaryVanEck, Gold Monthly Commentary, January 2026The US$5,595 intraday high and the speculative-buying description; VanEck manages gold and gold miner funds; read 2026-10-20Feb 2026
- DataWorld Bank, Commodity Price Data (The Pink Sheet), monthly pricesGold monthly averages, a spot average from June 2025; updated October 2, 2026; read 2026-10-20Oct 2, 2026
Not investment advice, and read the first disclosure again. A member of the Convexity team owns physical gold and stands to benefit if its price rises, so we are not neutral on the gold price. The same team member holds SPY, which holds Newmont among its 500 companies; no position in gold funds or other gold miners, and no other position. This note is analysis of public data, published for research purposes, and not a recommendation to buy, sell or hold gold or any security. It was drafted with Claude.
What here is ours rather than the sources'. As published: every gold price on a named day, every Treasury yield, the breakeven rates, the dollar index levels, the Nasdaq and S&P 500 closes, the Brent and gasoline prices, the inflation rates the BLS states, the Fed's decisions and statements, VanEck's intraday high, the World Bank's monthly averages, every tonnage, flow and futures position the World Gold Council reports (including the 211t, 4,256t, 84t, 96t and 387t), and the CFTC's contract counts. Ours: every percentage change in gold, the dollar and the stock indexes, including the 23.2%, 24.5%, 25.7%, 26.1%, 19.6%, 8.1%, 3.1% and 46.7% comparisons and the 7.5% fall in the quarterly average; every change in basis points, including the 94 of 103; the count that made January 30 the largest one-day fall in the afternoon price since April 2013, over the series from 2003; the "since November 2008" comparison, from the real yield series since 2003; the observations that October 14's price was the lowest since August 4 and October 23's the lowest since July 29; the breakeven range of 2.18% to 2.50%, and the breakeven after October 19 as the par yield less the real yield; the observation that this was the first October with gasoline above $4 in the EIA's weekly series; the reading of the 2-year yield against the Fed's range; the $1,720, $2,660 and $2,950 illustration and the 55% rise; the division of the year into eight stretches; the sum of the Council's weekly regional ETF holdings into the 4,279t and the 22.5t added in October; the conversion of the CFTC's contract counts into the 338.0t and 48.9t; the weekly regressions (5.5%, 3.3%, 12.7%, 15.1%, 17.7% and 10.2% per percentage point, and their shares of weekly variation), the 2.2% and 1.0% rises the 2026 sensitivity implied for the weeks to October 16 and October 23, the largest weekly fall in the real yield since April 2025, and the roughly 7% (6.6%) that the 2008 to 2021 relationship implies; the March 2020 comparison; and the reading of the flows as a split between owners and futures traders. The regressions measure association over a short window; they are not a model of the gold price.