









Disclosure. Not investment advice, and nothing here is a recommendation to buy, sell or hold any security. A member of the Convexity team holds the SPDR S&P 500 ETF (SPY), which holds Adobe, Mastercard and Costco, all named below; no other position. Sales figures are the Census Bureau's, as revised on September 28, 2026, with its advance estimates for September of October 15; prices and earnings are from the Bureau of Labor Statistics and the Bureau of Economic Analysis; income, spending and saving are the BEA's; the forecasts are quoted from the forecasters' own releases. The price measure we build for the goods in the holiday count, and every split of a forecast into price and volume, are our arithmetic, and the closing note lists them. This note was drafted with Claude.
Every holiday forecast published this autumn is in dollars. Deloitte expects retail sales from November through January to rise 4.0% to 4.8%. Bain expects November and December to rise 4.5%, and the National Retail Federation, which published on October 15, expects 4.2%. The Mastercard Economics Institute expects 5.5% between November 1 and Christmas Eve, and Adobe expects online spending to rise 6.7%. None of those figures is adjusted for prices, and consumer prices rose 3.7% in the year to September, faster than the 3.4% to August, so the easy reading is that most of this year's growth will be inflation. Two of the forecasters say roughly that. Bain says more than half of its growth will come from higher prices, and Mastercard says about half.
The 3.7% is the wrong measure for that sum. It is pulled up by gasoline, whose price rose 34.2% in the year to September and accounted for over half of September's monthly rise, and every one of these forecasts leaves gas stations out of the count. It also carries rent, airfares and the rest of the services economy, none of which is sold in a store. Measured on the goods the counted stores actually sell, prices rose 1.4% in the year to September on the consumer price index, down from 1.7% in the year to August. The Bureau of Economic Analysis's price index for the same goods, whose September figures are not due until October 29, rose about 2.3% in the year to August. Both measures are our arithmetic on the agencies' data. The first is slower than a year earlier, and has slowed in every month since April. The second is faster than a year earlier, and electronics account for almost all of the difference.
That makes the forecasts a bet on volume, meaning more things bought rather than the same things at higher prices. On the Census Bureau's revised figures, sales last November and December grew 3.1% on the definition Bain uses, and 1.8 points of that was price, which leaves 1.3 points of volume. Bain's 4.5% at September's prices needs 3.1 points of volume on our CPI measure, or 2.2 points on the BEA's measure to August. The NRF's 4.2% needs 2.8 points on our measure. Either way, volume has to grow far faster than it did last season, and most of the extra growth the forecasts expect over last year has to be volume rather than price.
September's retail sales, published on October 15, are the first evidence that this volume exists. Core retail sales, the industry's term for sales excluding autos, gasoline and restaurants, were 4.6% higher in September than a year earlier, seasonally adjusted, and with our price measure at 1.4% that is 3.2 points of volume, the most in any month this year and just above what Bain needs. Two things temper it. One is that September's figure is an advance estimate whose strength was made in August: core sales rose 1.1% from July to August and 0.1% from August to September. The other is the shopper producing it, who earns less per hour, after inflation, than a year ago. Real average hourly earnings fell 0.7% in the year to September, the saving rate in August was more than a point lower than a year earlier, and regular gasoline has cost more than $4 a gallon in every week since mid-July.
Census Bureau monthly retail sales, revised September 28, 2026, and advance estimates of October 15; BLS consumer price index and real earnings, September 2026; Bain & Company forecast of September 3, 2026. The price measure, the growth rates and the splits are our arithmetic.
What each forecast counts
The forecasts measure different things over different weeks, and the differences matter for any comparison with prices.
| Forecaster | Published | Period | What it counts | Growth | What it says about prices |
|---|---|---|---|---|---|
| Deloitte | Sept 10 | Nov 2026 to Jan 2027 | Census retail and restaurant sales, seasonally adjusted, less autos and gasoline | 4.0% to 4.8% | Tied to disposable income growth of 4.5% to 5.2% |
| Bain | Sept 3 | Nov and Dec | Census retail sales, unadjusted, less auto and auto parts dealers, gasoline and restaurants | 4.5% | More than half from inflation |
| National Retail Federation | Oct 15 | Nov and Dec | Census retail sales, unadjusted, less auto dealers, gasoline and restaurants | 4.2%, to $1.013 trillion | Names inflation and gas prices as pressures; no split |
| Mastercard Economics Institute | Sept 23 | Nov 1 to Dec 24 | Its SpendingPulse retail data, less autos and gas | 5.5% | About half from higher prices |
| Adobe | Sept 28 | Nov 1 to Dec 31 | Spending on U.S. retail websites | 6.7%, to $275.1 billion | Not stated |
Deloitte forecasts $1.70 trillion to $1.71 trillion for the three months, with e-commerce rising 7.5% to 8.4% to between $316.1 billion and $318.9 billion. Its release describes the base as Census retail sales "seasonally adjusted and excluding automotive and gasoline," which grew 4.1% to $1.63 trillion in the same months a year earlier. We reproduced both figures, to the precision Deloitte gives, from the Census data as they stood before September 28. The growth rate comes out at 4.1% with or without restaurant sales, but the $1.63 trillion only with them, so restaurants are in Deloitte's count. Akrur Barua, an economist at Deloitte Insights, ties the forecast to income: "We project DPI to grow between 4.5% to 5.2% during the holiday season, which we believe to be a strong predictor of retail and e-commerce sales." DPI is disposable personal income.
Bain's methodology note defines its count as unadjusted Census sales at stores and online, "excluding sales by auto and auto parts dealers, gas stations, and restaurants," for November and December. It expects 4.5% growth "in nominal terms," against 3.5% for last season, with sales outside stores up 9% and sales in stores up 2.5%. It says plainly: "Inflation will account for more than half of the nominal rise in sales." The Mastercard Economics Institute's 5.5% covers November 1 through December 24 and is drawn from its SpendingPulse data, which it says represents spending in stores and online across all forms of payment, with online sales up 11% and in-store sales up 3.6%, and it "estimates about half the growth in spending will be due to higher prices."
The National Retail Federation's forecast, published on October 15, is the latest of the five. It expects November and December sales to rise 4.2% to $1.013 trillion, against $972 billion last season, on a count that excludes automobile dealers, gasoline stations and restaurants. That is Bain's definition with one difference: the NRF keeps auto parts, accessories and tire stores, which sold about $22 billion last November and December, and that difference is enough to put the NRF's count above $1 trillion and Bain's below it, as the next section shows. The NRF names "inflation, rising gas prices and pressure on household spending" as forces that "will affect consumers differently across income groups," but does not say how much of its 4.2% it expects to be price. Its explanation of why it forecasts in dollars is the best short statement of the problem this note is about: "Calculating a 'real' (adjusted for inflation) growth number is much more complicated than subtracting inflation from nominal retail sales growth. Each individual product has different inflation levels associated with it."
Adobe's $275.1 billion counts online spending only, measured across U.S. retail sites, and its 6.7% growth is against the $257.8 billion it reported for the 2025 season. Its release forecasts discounts "on par with the 2025 season" and says nothing about prices otherwise. Adobe also publishes an online price index, the Digital Price Index, but the latest month shown on its page on October 12 was July 2025, so it cannot say what online prices are doing now.
The price measure that matches the count
The consumer price index is a basket of everything households buy, weighted by what they spend on it. Most of that basket is never sold in the stores these forecasts count. In the year to September, the index for services other than energy rose 3.1%, shelter rose 3.2%, and airline fares rose 22.4%. Gasoline rose 34.2%, and energy as a whole 20.4%. The index excluding food and energy, which many readers know as core inflation, rose 2.6%, and Bain's outlook cites a similar figure: "strip out gas and energy, and prices are rising 2.5%." That figure still carries rent, insurance and medical care.
The goods side tells a different story. The index the Bureau of Labor Statistics calls commodities less food and energy commodities, core goods for short, rose only 0.7%. But core goods include new and used cars, which are sold by the auto dealers every holiday forecast excludes. Used cars and trucks fell 1.5% over the year and new vehicles rose 0.6%, and in December's weights cars, trucks and their parts were 6.9 of core goods' 19.2 points of the index. Take them out and the rest of core goods, the clothes, toys, electronics, furniture, medicines and household goods that stores do sell, rose 1.2%. Add food at home, which rose 1.8%, at the weight the bureau gives it, about 40% of the combination, and prices of the goods in the holiday count rose 1.4% in the year to September.
That figure is ours, built from the bureau's published indexes and its own weights, chained each December the way the bureau chains its aggregates. We checked the method by rebuilding the published food index from its two parts, food at home and food away from home, and it matched to within a thousandth of a percentage point in every December from 2021 to 2025 and in August and September 2026.
Inside the 1.4% the categories move in opposite directions. Apparel rose 3.4%, footwear 3.4%, sporting goods 4.7%, toys 6.6% and personal care products 2.1%. Computers, peripherals and smart home assistants rose 9.7%. Smartphones fell 9.9%, televisions 1.9%, furniture and bedding 2.4%, and medicines and medical supplies, which the bureau calls medical care commodities, 3.3%. Household furnishings and supplies as a group rose 0.2%. Toys are the category to watch for the season: their index rose 4.7% in September alone, before seasonal adjustment, and their twelve-month rise went from 2.3% in August to 6.6%.
The Bureau of Economic Analysis prices the same kinds of goods in its consumer spending accounts, with different weights and some different methods, and its latest month is August. Combining its six goods categories that exclude motor vehicles and gasoline, prices rose about 2.3% in the year to August (our arithmetic), when our CPI measure stood at 1.7%. Almost all of the difference is electronics. The BEA's price index for information processing equipment rose 13.3% over that year, against 8.4% for computers in the CPI, and the Mastercard Economics Institute cites a 12.2% rise in the BEA's broader index for video, audio, photographic and information processing equipment, which it attributes in part to demand for memory chips from the AI buildout, the shortage our note on the memory cycle described from the suppliers' side. Hold the BEA's recreational goods category, which includes computers and phones, to the 3.1% rise the CPI recorded for recreation goods in the year to August, and the BEA measure comes out at 1.7%, the same as ours for that month (our arithmetic; the two agencies draw the categories differently, so this is an illustration rather than a reconciliation). We use both measures below, because the conclusion has to survive the less favorable one. The BEA's September figures arrive on October 29, after this note.
Deloitte's count includes restaurants, where prices rose 3.5%. Adding food away from home at its own weight raises our measure for Deloitte's definition to 1.9% in the year to September.
The direction matters too. Our CPI measure peaked at 2.5% in April and has fallen in every month since, to 1.7% in August and 1.4% in September. The core goods part of it peaked at 2.3% in March and was 1.2% in September. The slowdown followed the end of the tariffs imposed under the International Emergency Economic Powers Act, which the Supreme Court held in February the law does not authorize, and retailers have been spending some of the refunds on lower prices: our note on Costco's refund found Costco put about half of its own into prices. Other tariffs remain, and nothing here says what they will do by December. Food at home did much of September's work, slowing from 2.2% in August to 1.8%. Through September, goods prices were slowing into the season, not accelerating.
What last season actually did
The baseline every forecast grows from moved on September 28. The Census Bureau revised its monthly retail estimates "based on historical corrections and the results of the 2023 and 2024 Annual Integrated Economic Survey," its notice says, and the revision lowered both the level of sales and their recent growth.
On Deloitte's definition, last season's sales were $1.63 trillion, up 4.1%, before the revision. They are now $1.55 trillion, up 3.3%. On Bain's definition, last November and December came to $989.0 billion before the revision, up 3.6%, and come to $950.6 billion now, up 3.1%. All four figures are our arithmetic on the Census data, before and after. The levels fell by roughly 4% to 5%, which matters for the headline numbers the forecasts print: on the revised base, Bain's 4.5% gives about $993 billion, not the "$1 trillion for the first time" its release announces, and topping $1 trillion would take growth of about 5.2%. Deloitte's 4.0% to 4.8% on the revised base gives about $1.61 trillion to $1.62 trillion rather than $1.70 trillion to $1.71 trillion.
The NRF wrote its forecast after the revision, and its numbers fit the revised data exactly. Keeping auto parts stores in Bain's count reproduces the $972 billion and the 3.1% growth the NRF gives for last season (our arithmetic), and 4.2% on that base is $1.013 trillion. So a 2026 season crosses $1 trillion on the NRF's count at 4.2% growth and would need about 5.2% on Bain's. A year ago the NRF put 2024 at $976.1 billion and forecast 3.7% to 4.2% growth, to $1.01 trillion to $1.02 trillion, for 2025. On the revised figures 2025 came to $972 billion, up 3.1%, below that range on both counts; before the revision, growth on Bain's definition was 3.6%, also short of it (our arithmetic). Whether a season tops $1 trillion is a fact about which stores are counted and which vintage of the data is used, and says nothing about shoppers.
The growth rates matter more than the levels, because they set what a forecast is asking for. On the revised figures, last season's 3.1% was 1.8 points of price and 1.3 points of volume, on our CPI measure for the same two months. The BEA's measure gives almost the same split: its goods prices rose about 1.7% over the season. So last season was the pattern Mastercard describes, with half or more of the growth coming from prices.
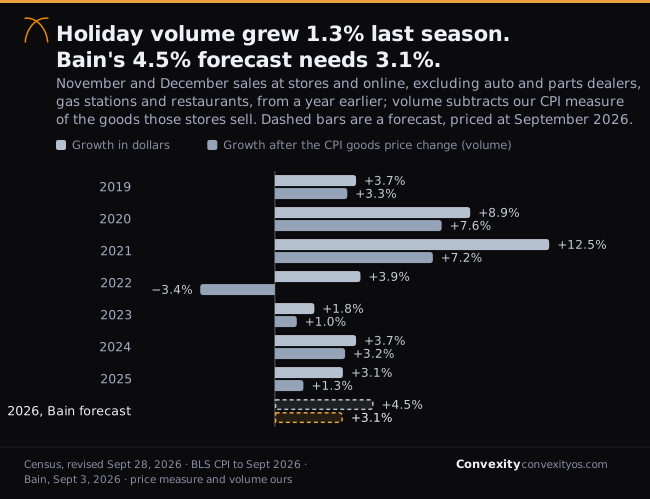
The history puts the forecast in proportion. Holiday volume grew 3.3% in 2019, by more than 7% in each of the two pandemic seasons, and then fell by 3.4% in 2022, when prices of these goods rose 7.3% and sales in dollars rose only 3.9%. It grew 1.0% in 2023, 3.2% in 2024 and 1.3% in 2025. Bain's forecast at September's prices needs 3.1%. That is more than twice last season's and a tenth of a point below 2024's, so it is not an extraordinary number. It is a return to the 2024 pace, and none of the forecasts says where it comes from.
The same arithmetic on Deloitte's definition gives the same answer. Its season grew 3.3% after the revision, with 2.3 points of price on our measure including restaurants and 1.0 of volume. Its forecast of 4.0% to 4.8%, at the 1.9% price change in that measure for the year to September, needs 2.1 to 2.9 points of volume.
What the forecasts need from this season
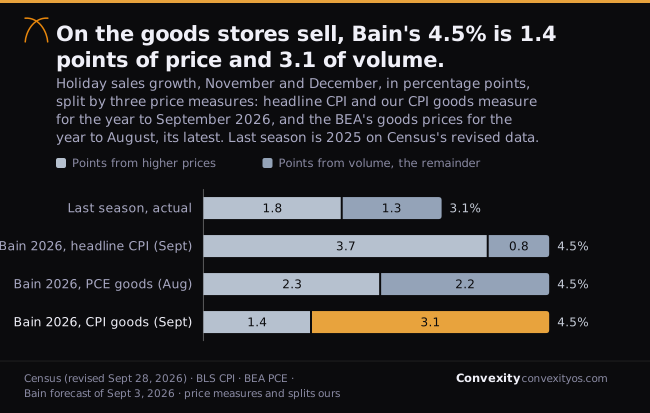
The choice of price index decides the answer, so it is worth seeing all three. Split Bain's 4.5% using headline inflation and price is 3.7 points, more than four-fifths of the growth, with 0.8 point of volume left over. That is the reading behind the claim that this year's growth is mostly inflation, and it treats a gallon of gasoline and a month's rent as part of the holiday basket. Split it using the BEA's goods prices and price is 2.3 points and volume 2.2, which is Mastercard's "about half." Split it using our CPI measure and price is 1.4 points and volume 3.1.
So Bain's "more than half" holds on the headline figure, and by a hair on the BEA's measure, where 2.26% is just over half of 4.5%. It does not hold on the CPI measure, where price is less than a third. The two goods measures agree on the thing that matters more for retailers, which is the change from last season. On the CPI measure, price is doing less of the work than last season, 1.4 points against 1.8, so more than the whole step up from last season's revised 3.1% to 4.5% is volume. On the BEA's, price does about 0.6 point more than last season and volume about 0.8 point more. On neither does inflation explain the acceleration the forecasts expect.
The NRF's 4.2% asks for 2.8 points of volume on our measure and 1.9 on the BEA's. Mastercard's 5.5% asks for still more. Its definition is its own, so our measures fit it less exactly, but on either of them it leaves 3.2 to 4.1 points of volume, at least as much as any season since 2021. Adobe's online forecast cannot be split at all without an online price index. Its largest category, electronics at $63.3 billion and up 5.9%, is also where the two government measures disagree most. In the CPI, computers rose 9.7% in the year to September but smartphones fell 9.9%, and information technology goods as a whole fell 2.9%; the BEA's broader electronics index rose 12.2%, by Mastercard's account. Bain expects sales of electronics and appliances to stay flat. A dollar forecast for electronics says less about volume than one for any other category.
The year so far is the best evidence for whether that volume exists. On the revised Census figures, core retail sales grew 4.2% from January to September, and our CPI measure rose 2.0% over the same months, which leaves about 2.2 points of volume (our arithmetic). The monthly figures were uneven, as the chart below shows: 1.1 points in January, 3.1 in May, 2.9 in August and 3.2 in September. Only May and September reached what Bain needs. So the forecasts are asking the holiday season to match the best months of 2026 rather than its average, and the two latest months happen to be among the best. Most of them set that target before the revision, when the data said the year was running more than a point faster. Through July, the latest month when Deloitte and Bain published, core retail sales stood 5.3% above a year earlier on the figures as they then stood; through August, when Mastercard published, 5.2%. The revised figures put January to August at 4.1% (all our arithmetic). A forecast like Bain's 4.5%, which looked like a slowdown on the old figures, is an acceleration on the new ones.
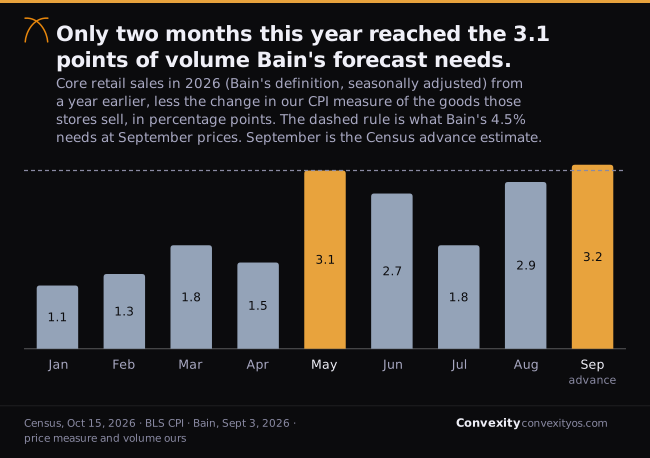
September deserves the weight it gets here, and no more. It is an advance estimate from a subsample of about 4,800 retailers, which Census revises in each of the next two months; the same release revised August's growth in total sales from 1.1% to 1.3%. And most of September's strength from a year earlier was made the month before. Core sales on Bain's definition rose 1.1% from July to August and 0.1% from August to September, so both months stood 4.6% above a year earlier, and September's extra volume comes from its lower price change rather than from more buying. What September shows is that August's jump held. Whether it was a step up or a bulge is what October's figures, due November 17, will start to say.
The shopper who has to deliver it
The consumer spending accounts show how this year's volume has been paid for. In the year to August, the BEA's latest month, consumer spending after inflation rose 2.6% and spending on goods 2.7%. Disposable income after inflation rose 1.3% (our arithmetic on the same accounts). The difference came out of saving. The saving rate, the share of after-tax income not spent, was 4.1% in August, down from 5.2% a year earlier.
That rate has a caveat that cuts in the shopper's favor. The BEA's annual update, published with the August figures on September 30, revised the accounts back to January 2021, and it raised the recent saving rate substantially: June, which Bain's outlook cited as 2.7%, now stands at 4.4%. Households had more cushion than the forecasts were written against. They have still been drawing it down, by 1.1 points of income in a year, to buy more goods than their income growth would pay for.
Income growth is now slowing, and pay has fallen behind prices. Employers added 29,000 jobs in September, against an average of about 45,000 a month in the twelve months to August, and the Bureau of Labor Statistics revised July to a loss of 10,000. Average hourly earnings rose 3.0% over the year to September, the slowest twelve-month rise since May 2021 (our check of the series). With consumer prices up 3.7%, the bureau's real average hourly earnings fell 0.7% over the year to September, and a longer average workweek held real weekly earnings to a fall of 0.1%. Deloitte projects disposable income growing 4.5% to 5.2% over the season. Its release does not say whether that is before or after inflation, but the range brackets the 4.8% rise in dollars over the year to August, which after inflation was the 1.3% above.
Gasoline is taking a growing share of whatever income there is. The Energy Information Administration's weekly survey put regular gasoline at $4.284 a gallon in the week of October 19, against $3.019 a year earlier, a rise of 42% (our arithmetic), though down from $4.478 in the week of September 21. AAA, which reported a national average of $4.36 on October 8, said, "This is the first year the national average has been above $4 per gallon in October." Sales at gas stations, which every holiday forecast leaves out, were 28.1% higher in September than a year earlier on the Census figures, and $81.2 billion higher over the first nine months of 2026 than over the same months of 2025 (our arithmetic). If they run 28.1% above last year in November and December, shoppers will spend about $28 billion more at the pump over the two months. Bain's 4.5% adds about $43 billion to holiday sales on the revised base. The extra spending at the pump would be about two-thirds of the extra spending the forecast expects in stores, out of the same budgets (both our arithmetic).
The University of Michigan's survey of consumers reads the mood. Its sentiment index was 48.0 in its final October reading, a tenth of a point below September's 48.1 and down from 53.6 a year earlier, and its low for this year, 44.8 in May, is the lowest in the series' history (our check of the survey's published table). Its October 9 special report on gasoline prices found that "Only about 31% of consumers expect to spend as usual in the year ahead on items that have large price increases," while 54% expect to cut back and 16% to stop buying them. The split by income is wide. Among the lowest third of incomes, 20% expect to spend as usual; among the top third of stockholders, 50% do. When asked what they would cut first, the report says, "the most common responses included food/groceries; household items including durables; car buying, eating out, and vacations."
Where the volume could come from
The forecasts point to three sources, and each has evidence behind it.
The first is online. On the revised Census figures, sales at nonstore retailers, the bureau's category for online and catalog sellers, rose 8.0% from January to September, and in-store sales rose 2.8%. Bain's channel forecasts, 9% online and 2.5% in stores, are close to that year-to-date pattern. Mastercard's 11% online and 3.6% in stores are above it. Last November and December, nonstore sales rose 5.4% and made up 28.8% of the season's sales on the revised figures. Online growth this year has been running faster than it did in last year's holiday season, which is the strongest support the forecasts have.
The second is the top of the income distribution. Mastercard says "higher-income households have likely set the pace" of spending this year, though it adds that spending has continued across income groups, and Bain cites a 23% rise in the S&P 500 over the year as support for upper-income budgets. The Michigan survey's split fits that: the households most likely to keep spending are the ones with stock portfolios. A season carried by those households can deliver volume in apparel, electronics and gifts while the bottom of the market trades down.
The third is lower prices. Bain names retailers passing tariff refunds to shoppers as price cuts among its tailwinds. Price cuts help sales volume, but they also lower the price half of any split, so a season of deeper discounts needs even more volume to reach the same dollars. Adobe expects discounts of up to 30% off listed prices during Cyber Week and calls them on par with the 2025 season, so it is not forecasting deeper ones.
Food is where the strain shows first. Groceries come first on the Michigan list of planned cuts, though the survey's authors think shoppers there are more likely trading down to cheaper brands than buying less food, and food at home is about 40% of our price measure. Our note on packaged food volume found volume falling at seven of the nine food makers that report it, with more price increases on the way. Grocery store sales were 0.9% higher in September than a year earlier on the Census figures, with food-at-home prices up 1.8%, which suggests the grocery aisle is losing volume while the rest of the store gains it (our arithmetic; grocery stores sell more than food, and food is sold in other stores too). If that continues, the rest of the store has to grow faster still to hit any of these forecasts.
The case against this note
There are three good arguments that the forecasts are right about prices, and they deserve to be stated fully.
The first is that our CPI measure may understate the prices holiday shoppers will pay. The CPI weights each item by what all households spend on it, not by what retailers sell in November and December, and the holiday mix leans toward apparel, toys and computers, where prices are rising faster than the average: toys rose 6.6% and computers 9.7% in the year to September. The BEA's measure, which gives computers more weight, already put goods prices at 2.3% in August, half of Bain's forecast. Higher fuel costs can reach the prices of goods with a lag, and the Michigan survey found year-ahead inflation expectations at 4.7% in October. If our measure climbs back to its April peak of 2.5%, more than half of Bain's 4.5% would be price, and Bain's statement would hold.
The second is that 3.1 points of volume is not much to ask, and September is the evidence. The 2024 season delivered 3.2. May and September this year delivered 3.1 and 3.2, and August 2.9. Real spending on goods rose 2.7% in the year to August. The revised saving rate shows more cushion than the forecasters had in front of them when they wrote, and equity wealth is up.
The third is that the revision cuts both ways. If the 2025 base was too high, so was the base for every other recent year, and the growth rates moved by less than the levels: last season's growth fell by about half a point on Bain's definition and eight-tenths on Deloitte's. Revisions to the advance monthly data are routine, and the September 28 figures can be revised again.
We accept the first argument as the main risk to this note, which is why the figures above are given on both government measures. The second is stronger since the September retail figures, and we take it seriously: the volume the forecasts need was there in August and September. But the 2024 season came with prices that were barely rising and income after inflation growing 2% to 3% a year (our arithmetic on the BEA's figures), and neither is true now. What the record supports is narrower than a claim that the forecasts are wrong. They ask for the volume of this year's best months, sustained through December, from shoppers whose income after inflation is growing at less than half that pace, whose hourly pay is now falling behind prices, and who have been spending their savings to keep up.
What would prove this wrong
- Goods prices come back. The October consumer price index is due on November 10, but BLS has no index for October 2025, which it marks unavailable because of the 2025 lapse in appropriations, so October will not give our measure a twelve-month change. November's, due on December 10, will. If our measure's twelve-month rise reaches 2.3% or more, price becomes half or more of Bain's 4.5% on the CPI as well as the BEA's figures, and the forecasts are no longer mainly a bet on volume.
- The late-summer pace holds. October retail sales are due on November 17. September already showed core retail sales 4.6% above a year earlier with our price measure at 1.4%, the volume the forecasts need. A second and third month like it, without a further fall in the saving rate, would show the volume arriving on its own footing and would make the income and saving arguments here matter much less.
- The season itself. November retail sales are due on December 16 and December's on January 15, with the CPI for November on December 10 and for December on January 13. If November and December sales on Bain's definition rise 4.5% or more with goods prices near 1.5% to 2%, the bet on volume paid off. If they rise nearer last season's 3.1%, it did not.
- Saving stops falling. The BEA's September figures, due on October 29, will show whether the saving rate keeps sliding from 4.1%. A stable rate with spending growth intact would mean income, not saving, is funding the season.
The data and documents this is built on
- ReleaseU.S. Census Bureau, Advance Monthly Sales for Retail and Food Services, September 2026September advance and September 2025 revised sales, the nine-month totals, and the revision of August; read at the current-release address 2026-10-20Oct 15, 2026
- DataU.S. Census Bureau, Advance Monthly Sales for Retail and Food Services, August 2026Carries the notice that monthly estimates were revised on September 28, 2026, after the 2023 and 2024 Annual Integrated Economic Survey; read 2026-10-12Sep 16, 2026
- DataU.S. Census Bureau, Estimates of Monthly Retail and Food Services Sales by Kind of Business, 1992 to presentRevised monthly sales by kind of business, adjusted and not adjusted, through August 2026; the holiday totals, growth rates and channel shares are ours; read 2026-10-20Oct 15, 2026
- DataFederal Reserve Bank of St. Louis, ALFRED vintages of Census retail sales (RSXFSN, RSMVPDN, RSGASSN)The Census figures as they stood on August 20, September 10 and September 25, 2026, before the revision; read 2026-10-20Read Oct 20, 2026
- ReleaseBureau of Labor Statistics, Consumer Price Index, September 2026Table A and Table 2: the twelve-month changes for all items, energy, gasoline, core goods, vehicles, food, apparel, toys, electronics and the other goods categories citedOct 14, 2026
- ReleaseBureau of Labor Statistics, Consumer Price Index, August 2026The August twelve-month changes cited for comparisonSep 11, 2026
- DataBureau of Labor Statistics, CPI-U index levels, U.S. city average, not seasonally adjustedCore goods, new vehicles, used cars and trucks, vehicle parts, food at home, food away from home, food and all items, 2017 to September 2026, read from the St. Louis Fed’s mirror of the BLS series; BLS marks October 2025 unavailable; read 2026-10-20Sep 2026
- DataBureau of Labor Statistics, Relative importance of components in the Consumer Price Indexes, December 2017 to December 2025The weights our price measure is chained on; read 2026-10-12, and 2020 to 2025 again 2026-10-20Dec 2025
- ReleaseBureau of Labor Statistics, Real Earnings, September 2026Real average hourly and weekly earnings for all employees, September 2025 to September 2026Oct 14, 2026
- ReleaseBureau of Economic Analysis, Personal Income and Outlays, August 2026The saving rate, the PCE price index and the annual update revising estimates back to January 2021Sep 30, 2026
- DataBureau of Economic Analysis, monthly NIPA data, Tables 2.6, 2.8.4 and 2.8.5Real disposable income, real spending, and spending and prices by type of good, through August 2026; the goods price measure excluding vehicles and energy is ours; read 2026-10-20Aug 2026
- ReleaseBureau of Labor Statistics, The Employment Situation, September 2026Payrolls, revisions to July and August, and average hourly earningsOct 2, 2026
- DataU.S. Energy Information Administration, weekly U.S. regular all formulations retail gasoline pricesWeeks of September 21, 2026, October 20, 2025 and October 19, 2026; read 2026-10-20Oct 19, 2026
- ReleaseAAA, Pump Prices Remain at Record Highs for AutumnThird party; retrieved 2026-10-20Oct 8, 2026
- DataUniversity of Michigan, Surveys of Consumers, final results for October 2026The sentiment index and its monthly history; read 2026-10-23Oct 23, 2026
- ReportUniversity of Michigan, Surveys of Consumers, Gasoline Prices and Expected Consumer SpendingSpending intentions by income and stock ownership, interviews June 23 to September 21, 2026Oct 9, 2026
- ForecastDeloitte, Deloitte Forecasts Holiday Retail Sales to Reach $1.70 Trillion to $1.71 TrillionThird party; retrieved 2026-10-20Sep 10, 2026
- ForecastBain & Company, US holiday retail sales set to outpace last year’s seasonal growth performance to exceed $1 trillion for the first timeThird party; retrieved 2026-10-20Sep 3, 2026
- ForecastBain & Company, 2026 Holiday Shopping OutlookThe methodology note defining retail sales, the inflation and saving rate figures cited, and the tailwinds; third party; retrieved 2026-10-20Sep 2026
- ForecastNational Retail Federation, NRF Forecasts 2026 Holiday Sales Growth as Consumers Remain ResilientThe 4.2% forecast, the $972 billion 2025 base and the definition; third party; retrieved 2026-10-20Oct 15, 2026
- ForecastMastercard, From AI-powered planning to the Christmas Eve rush: What to expect this holiday seasonThe Mastercard Economics Institute forecast; third party; retrieved 2026-10-20Sep 23, 2026
- ForecastAdobe: U.S. Holiday Shopping Season to Hit Record $275.1 Billion Online, Rising 6.7% YoYThird party; retrieved 2026-10-20Sep 28, 2026
- ReleaseAdobe: Holiday Shopping Season Drove a Record $257.8 Billion Online with Consumers Embracing Generative AI ToolsThe 2025 season the 6.7% grows from. The PDF dateline reads January 7, 2025, which the covered period and the file path show is a typo for 2026; third party; retrieved 2026-10-12Jan 7, 2026
- DataAdobe Digital Price IndexLatest month shown on October 12, 2026: July 2025; third partyRead Oct 12, 2026
- FAQNational Retail Federation, Winter Holiday FAQsHow NRF defines retail sales, and why it does not forecast in real terms; third party; retrieved 2026-10-20Read Oct 20, 2026
- ReleaseNational Retail Federation, NRF Expects Holiday Sales to Surpass $1 Trillion for the First Time in 2025The 2025 forecast and the $976.1 billion it gave for 2024; third party; retrieved 2026-10-20Nov 6, 2025
- ScheduleU.S. Census Bureau, retail release scheduleAdvance monthly retail release dates for October to December 2026 data; read 2026-10-20Read Oct 20, 2026
- ScheduleBureau of Labor Statistics, Schedule of Releases for the Consumer Price IndexRelease dates for October to December 2026 data; read 2026-10-20Read Oct 20, 2026
- ScheduleBureau of Economic Analysis, release schedulePersonal Income and Outlays, September 2026, on October 29; read 2026-10-20Read Oct 20, 2026
Not investment advice. This note is an analysis of public statistics and published forecasts, written for research purposes, and not a recommendation to buy, sell or hold any security. A member of the Convexity team holds SPY, which holds Adobe, Mastercard and Costco; no other position. This note was drafted with Claude.
What here is ours rather than the sources'. As published: every forecast and every statement quoted from a forecaster, including the NRF's $972 billion and its 2024 figure of $976.1 billion; every twelve-month and monthly CPI change for a published index or category; real average hourly and weekly earnings; the BEA's saving rates, PCE price changes and annual update; payrolls, their revisions and the 3.0% rise in hourly earnings; the EIA and AAA gasoline prices and AAA's statement; the Michigan sentiment readings and survey shares; and the Census Bureau's monthly sales figures, its 28.1% and 0.9% year-on-year changes for gas stations and grocery stores, its revision of August's growth in total sales from 1.1% to 1.3%, and its revision notice. Ours: the CPI price measure for the goods in the holiday count (core goods less new and used vehicles and parts, plus food at home, and with food away from home for Deloitte's definition), chained on the BLS relative importances, and its 1.4%, 1.7%, 1.8%, 1.9%, 2.0% and 2.3% readings, its April peak of 2.5%, its monthly path and its validation against the food index; the 1.2% for core goods excluding vehicles and its March peak; the BEA goods price measure excluding vehicles and energy and its 2.3% and 1.7%; the 13.3% rise in the BEA index for information processing equipment; every holiday-season total and growth rate on the forecasters' definitions, before and after the revision, including $1.63 trillion, $1.55 trillion, $989.0 billion and $950.6 billion, and the reproduction of the NRF's $972 billion by keeping auto parts stores in the count; the year-to-date core retail, nonstore and in-store growth rates, before and after the revision, and the grocery volume reading; every monthly core retail growth rate and the monthly changes for August and September; every split of growth into price and volume, which subtracts the rounded price change from the rounded growth rate; the forecasts' levels on the revised base and the 5.2% needed for $1 trillion; the real income and spending growth rates; the payroll average; the 42% rise in gasoline, the $81.2 billion, $28 billion and $43 billion; the "lowest since" findings for earnings growth and sentiment; and the judgment that the forecasts are a bet on volume.