









Charts, September 13, 2026. Both charts on this page were rebuilt from AppLovin's filings. Built the way its caption describes, from four filed quarters of diluted EPS and the $326.66 after-hours print, the earnings chart ends at 556 and 71; the earlier chart ended at 558 and 69, and both halves of its title still hold. This page also said the peer comparison was pinned to that $326.66 print, but its table, its text and the peer chart all use the $334.49 print at 20:41 UTC, and now say so. And the trailing EPS of $11.64 quoted below covered the second quarter of 2025 through the first quarter of 2026, not the third. No other figure changed.
Disclosure. I own AppLovin and I doubled my position during the after-hours selloff this piece is about. That is a large and direct interest in you agreeing with me, and you should read everything below knowing it. This is not investment advice, I am not a licensed advisor, and nothing here is a recommendation to buy, sell or short any security. Every figure comes from AppLovin's SEC filings or from timestamped market data, cited at the end. Where a number is arithmetic on filed figures rather than a filed figure itself, I say so at the point I use it.
AppLovin reported the second quarter of 2026 after the close today. Revenue grew 53% to $1.924 billion, net income grew 55% to $1.267 billion, adjusted EBITDA grew 58% to $1.614 billion at an 84% margin, and diluted earnings per share came in at $3.76. The company earned a 66% net margin. It did that with 898 employees, which is the last figure the company has disclosed and is now seven months stale; research and development spending has more than doubled since, so the real number today is very likely higher.
The stock fell about 20% in the first half hour of after-hours trading, and had clawed back part of it within two.
I want to be precise about what the market objected to, because it was real and it was small. Revenue came in around one percent below where analysts had it. Third quarter revenue guidance of $2.055 to $2.085 billion brackets what the street was already carrying, so it was not a raise. And the adjusted EBITDA margin implied by that guidance is 83%, one point below the 84% just delivered. That is the entire bear case as of tonight: a sub-one-percent revenue miss, a guide that failed to beat, and a point of margin.
Against that, the multiple moved from roughly 32 times trailing earnings into the mid-twenties. I think the second number is wrong, and I bought more.
Quarter ended June 30, 2026. Growth rates are year over year. Source: Form 8-K Exhibit 99.1 filed August 5, 2026. The multiple is arithmetic on that release against after-hours prints between $322.92 and $345.70, timestamped 20:36 to 21:44 UTC the same day. It is a range because the price moved the whole time this was being written.
One filed detail is worth holding next to that number before anything else. In October 2025, AppLovin granted 920,526 performance stock units to key non-executive engineering employees which vest only on market capitalization milestones, beginning at $300 billion and running, for some of the awards, as high as $1 trillion, measured over any 30 consecutive trading days across a seven-year window. That is a compensation structure, not a forecast, and companies set aspirational bars they never clear all the time. I am not offering it as a price target and you should not read it as one. But it does say something about the distance between what the people building this treated as the stretch case ten months ago and where it is priced tonight, which is near $110 billion.
What the company actually is
A word on the business, because the margin is doing most of the work in this piece and it does not make sense without it.
AppLovin sells advertising. It runs an auction that places ads inside mobile apps, and what it really sells is the machine-learning model, Axon, that decides which ad to show and what to bid for the chance. It divested its mobile gaming studios in 2025, so what remains is close to pure software. The marginal cost of running one more auction is a fraction of a cent, which is why cost of revenue is 11.7% of revenue and why a 77.7% operating margin is arithmetic rather than alchemy.
That also locates the real risk, which is not in any quarterly release. The margin is high because the model is better than the alternatives. Nothing in tonight's filing tells you whether it still will be in three years, and no amount of multiple analysis substitutes for that judgment. Everything below assumes the model holds. If you do not believe that, the rest of this piece is irrelevant to you and you should not own the stock at any multiple.
The quarter, as filed
Here is the income statement without commentary, in millions, as reported.
| Q2 2026 | $M | Y/Y |
|---|---|---|
| Revenue | 1,923.7 | +53% |
| Cost of revenue | (225.8) | +46% |
| Sales and marketing | (63.4) | +35% |
| Research and development | (99.9) | +127% |
| General and administrative | (40.3) | -27% |
| Income from operations | 1,494.3 | +56% |
| Interest expense | (51.2) | |
| Other income, net | 62.4 | |
| Provision for income taxes | (239.0) | |
| Net income | 1,266.5 | +55% |
Operating margin was 77.7%, up from 76.1% a year ago. The effective tax rate was 15.9%.
Two lines in that table deserve more attention than the headline. Research and development more than doubled, from $44.0 million to $99.9 million, which is the largest proportional increase anywhere in the statement. General and administrative fell 27%. So the company spent aggressively on the thing that actually compounds and cut the thing that does not, and still expanded operating margin by 160 basis points while doing it. Total operating expense outside cost of revenue grew 39.5% against revenue growth of 52.8%. That gap is the whole margin story and it is not an accounting artifact.
One clarification on the headline growth rate, because it understates the business. The $819.5 million AppLovin earned in the second quarter of 2025 included $47.7 million from discontinued operations, the mobile gaming studios it divested last year. Comparing continuing operations to continuing operations, net income grew 64%, not 55%, and diluted EPS from continuing operations grew 66%. The 55% figure is the conservative one and it is the one I will keep using.
What the market actually objected to
The deceleration argument is the serious one, so let me state it at full strength before answering it.
Revenue growth was 53% this quarter. The midpoint of third quarter guidance implies 47% against the $1.405 billion AppLovin did in the third quarter of 2025. That is six points of deceleration guided one quarter out, and if you extend the line, it eventually intersects a growth rate that does not justify any premium at all. Every high-multiple compounder dies this way, and it always starts with a quarter that looks like this one.
Here is why I read the same numbers differently.
The comparison base gets meaningfully harder in the third quarter. Revenue went from $1.259 billion in the second quarter of 2025 to $1.405 billion in the third, a sequential jump of 11.6%, the steepest in the series. Growing 47% on top of that is a different achievement from growing 53% on top of a softer base.
There is a tempting second argument here that I want to defuse rather than use, because I nearly made it. You could observe that the first quarter of 2026 to the second was 4.4% sequential growth while the second quarter to the midpoint of the third quarter guide is 7.6%, and call that sequential acceleration. It is not. Those are different seasonal transitions and comparing them across the calendar proves nothing. Measured like for like, the same second-to-third-quarter step was 11.6% last year against 7.6% guided this year. Sequential growth is slowing as well.
So both things are true at once, and the honest version of the deceleration point holds both. Growth is decelerating on the year-over-year measure and on the sequential one, and it is decelerating against the steepest comparison quarter in the company's recent record. What a single guided quarter cannot tell you is the shape of the curve after it, which is the part the price is actually arguing about.
The margin point stands on its own and I will not argue it away. Guiding to 83% after delivering 84% is a real step down, and if it becomes a trend it matters a great deal at this multiple. One quarter of guided margin is not a trend, but it is the number I would watch first.
The repricing was a multiple event
The thing worth understanding about tonight is that almost none of the move came from earnings. Earnings went up.
There is a wrinkle here that caught me and is worth flagging, because it is probably on your screen right now too. Before this release, AppLovin's trailing twelve month EPS was $11.64, covering the second quarter of 2025 through the first quarter of 2026. At today's closing price of $417.92 that is a P/E of 35.9 and an earnings yield of 2.79%. Those are the numbers most screeners were showing this afternoon, and they are the numbers I was reasoning with going into the print.
They are now stale in both directions at once. The trailing window rolled off a $2.39 quarter and picked up a $3.76 quarter, taking trailing EPS to $13.01. And the price fell about 20%. Both moves push the multiple the same way.
| Price | P/E | Yield | Market cap |
|---|---|---|---|
| 417.92 (close) | 32.1 | 3.11% | $140.1B |
| 380.00 | 29.2 | 3.42% | $127.4B |
| 350.00 | 26.9 | 3.72% | $117.4B |
| 334.49 (after hrs) | 25.7 | 3.89% | $112.2B |
| 326.66 | 25.1 | 3.98% | $109.5B |
| 300.00 | 23.1 | 4.34% | $100.6B |
Yield in that table is the earnings yield, the inverse of the multiple, not a dividend; AppLovin does not pay one. Trailing EPS of $13.01 is the sum of four filed quarters: $2.45, $3.24, $3.56 and $3.76. Three come directly from XBRL facts in AppLovin's 10-Q filings. The fourth quarter of 2025 is not filed as a discrete quarter, so it is derived as full year 2025 diluted EPS of $9.75 less the $6.51 reported through September, which is exactly $3.24. Market cap uses the 335.291 million Class A and Class B shares outstanding at June 30, 2026, from tonight's balance sheet. I am showing a range rather than a single figure for a reason worth stating. Checking the after-hours price four times over about an hour returned $326.66, then $334.49, then $322.92, then $345.70. That last one is a 7% move off the low and takes the multiple back to 26.6. None of them will be the price when you read this, which is the honest situation and not a hedge: any single figure I picked would be decoration. If you want the number that matters, take the current price and divide by $13.01.
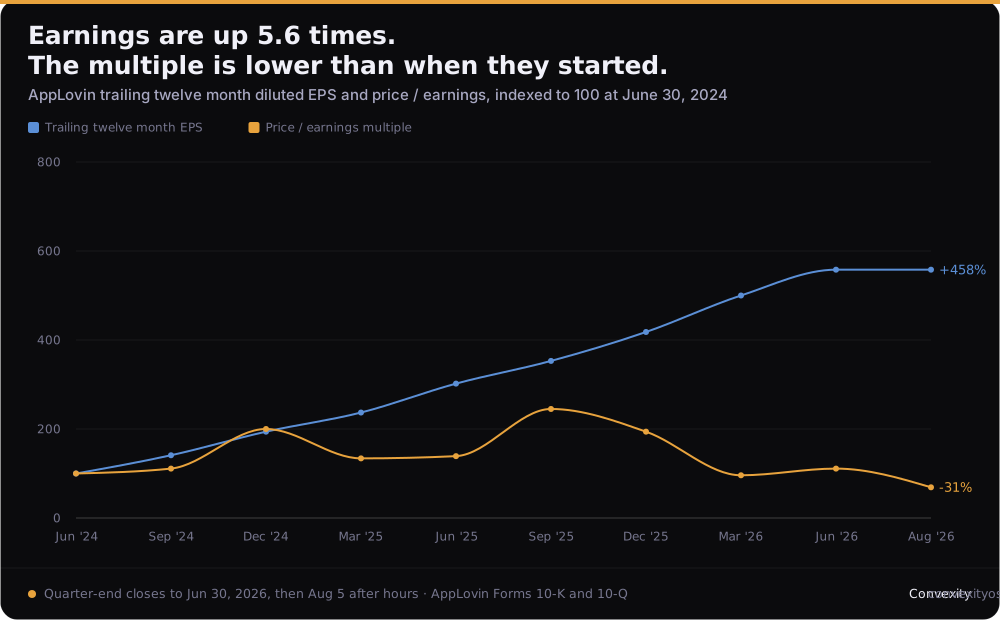
One caution about that chart, because it can be read two ways and only one of them favors me. The multiple has been 36, then 87, then 34, then 25 inside twenty-four months. A line that unstable is not a valuation anchor, and someone could fairly say the chart shows a market that has never settled on what this business is worth rather than a market that is wrong tonight. I think the earnings line is the more informative of the two, because it only travels in one direction. But I would rather hand you that objection than have it handed to me.
Two more framings, both explicitly arithmetic on a single filed quarter rather than forecasts. Annualizing this quarter's $3.76 of EPS gives $15.04 and a multiple near 22. Annualizing this quarter's adjusted EBITDA of $1.614 billion gives $6.46 billion against an enterprise value near $112.6 billion, so about 17 times. AppLovin carries $3.515 billion of long-term debt against $3.053 billion of cash, so net debt is $462 million and enterprise value barely differs from market cap.
And one forward figure, flagged clearly because it is the only number in this piece that is neither filed nor derived from something filed. Analyst consensus for the third quarter is $4.07 of diluted EPS. Roll the trailing window forward one quarter on that basis, dropping the $2.45 AppLovin earned in the third quarter of 2025 and picking up the consensus $4.07, and trailing EPS becomes $14.63 and the multiple falls to about 22. I am not estimating the fourth quarter and I am not going to. The point is narrower: the forward multiple here is lower than the trailing one, which is not what a business running out of road usually looks like.
The only peer growing faster costs ten turns more
This is the part that made me add rather than hold.
Below is every large advertising or platform comparable I could price on a consistent basis, using market capitalization divided by trailing twelve month net income, with each company's most recently reported quarter supplying the growth and margin columns. Tickers are Reddit, Meta, Alphabet and The Trade Desk. Prices are as of the August 5, 2026 close, except AppLovin, which appears twice: at its close, and at the $334.49 after-hours print timestamped 20:41 UTC. I have pinned this comparison and its chart to that single price rather than rewriting them each time the quote moved, so every figure in this section is internally consistent with each other and stale together. The sensitivity table above is there so you can reprice it yourself.
| P/E | Rev growth | Net margin | Period | |
|---|---|---|---|---|
| APP (after hrs) | 25.4 | +52.8% | 65.8% | Q2 2026 |
| APP (at close) | 31.8 | +52.8% | 65.8% | Q2 2026 |
| RDDT | 35.4 | +61.1% | 31.4% | Q2 2026 |
| META | 22.0 | +28.0% | 26.1% | Q2 2026 |
| GOOGL | 18.3 | +24.2% | 93.7% | Q2 2026 |
| TTD | 21.8 | +11.8% | 5.8% | Q1 2026 |
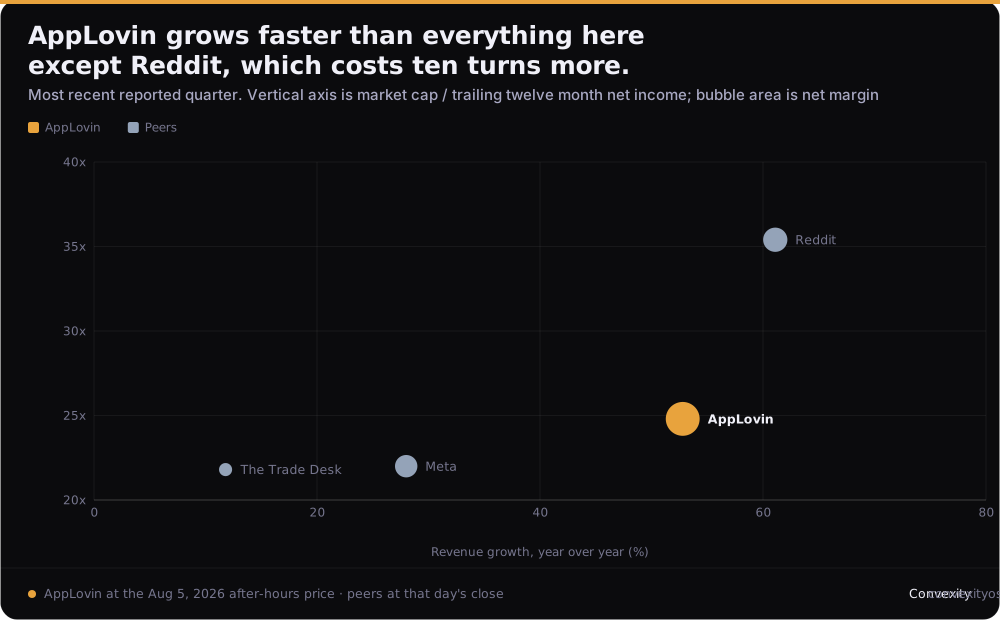
Reddit is the comparison that matters, because it is the only one growing faster. It grew revenue 61% against AppLovin's 53%, and for that eight points it commands 35.4 times earnings against AppLovin's 25.4, a 39% premium. It earns a 31.4% net margin. AppLovin earns 65.8%, more than double, on nearly two and a half times the revenue base. I can construct an argument for Reddit at 35 times. I cannot construct one where Reddit deserves 35 and AppLovin deserves 25.
The Trade Desk is the other end of the same point. It is the pure-play programmatic advertising comparison, it grew 11.8% in its most recent quarter, it earned a 5.8% net margin, and it trades at 21.8 times. AppLovin grows four and a half times faster at eleven times the margin for a 16% higher multiple.
Two honest caveats on that table. Alphabet's 93.7% net margin in the June quarter is not an operating result, and its trailing earnings clearly contain a large non-operating item, so its 18.3 multiple is not comparable to the others on operating earnings and I am including it for scale rather than as a valuation argument. And The Trade Desk's figures are its March quarter, the latest it has reported, so its column is a quarter older than everyone else's.
The pattern that survives those caveats is narrower than "AppLovin is the cheapest thing on this screen," because it is not. It trades above Alphabet, The Trade Desk and Meta. What it does is trade below the only company here growing faster than it, at more than twice that company's margin, while sitting less than four multiple points above a company growing at a fifth of its rate on a net margin of 5.8%. Put plainly: AppLovin has the second-highest growth rate on this screen, the highest genuine net margin by a factor of two, and the second-highest multiple. I think the third of those is the one that is out of place.
Where the earnings are not as clean as they look
If I only wrote the paragraphs above, this would be advocacy. Here is what I found looking for the other side, including one thing that genuinely tempers the bull case.
Free cash flow was $863.3 million against $1,266.5 million of net income, a conversion rate of 68%. Cash flow grew 12.4% while net income grew 55%. That gap is the single weakest number in the release. Working through the six-month cash flow statement, the reconciliation is mostly receivables: accounts receivable consumed $352.6 million of cash in the first half against a $311.7 million gap between net income and operating cash flow. Cash taxes paid also jumped from $100.6 million to $639.8 million year over year, which is a real and permanent normalization rather than a timing quirk.
The receivables build is less alarming than it first looks. Days sales outstanding actually improved, from about 126 days at the end of 2025 to about 103 days this quarter, so receivables grew but grew more slowly than revenue. That is arithmetic on the filed balance sheet and income statement rather than a disclosed metric. Still, 103 days is a long collection cycle, and it is the number that would tell you first if AppLovin were buying growth by extending terms to weaker advertisers.
The share count is doing the right thing. Shares outstanding went from 338.3 million at the end of 2025 to 335.3 million at June 30, down 0.89% in six months, and diluted weighted-average shares fell 1.5% year over year. AppLovin spent $1.533 billion on repurchases in the first half, which annualizes to roughly 2.2% of the market capitalization it carried into this print, or 2.8% of the smaller one it carries out of it. Unlike a lot of companies growing at this rate, it is not renting the growth from its own shareholders.
What would prove this wrong
I would rather name these than have you find them.
The margin guide becomes a trend. Guiding third quarter adjusted EBITDA margin to 83% after delivering 84% is the one genuinely negative number in this release. If the fourth quarter guides to 82% and the first quarter of 2027 to 81%, then the market read tonight correctly and I read it as noise. This is the falsifier I take most seriously and it is checkable in ninety days.
Free cash flow keeps diverging from net income. One quarter at 68% conversion is a working capital swing. Four quarters at 68% means the earnings are not the cash, and a multiple argued on earnings would be argued on the wrong number. Watch operating cash flow against net income, not the headline.
The tax rate normalizes. The effective rate this quarter was 15.9%, well below the 21% US statutory line, while cash taxes paid in the first half jumped from $100.6 million to $639.8 million year over year. Those two facts point in opposite directions, and in my experience the cash one wins eventually. If the GAAP rate drifts to 21% on the same pretax income, net income falls about 6% and every multiple in this piece rises by about the same. That does not break an argument made at 25 times. It would have broken one made at 35.
Concentration. This release does not break out revenue by customer or by vertical, and the e-commerce advertiser cohort that has driven much of the growth is not separately disclosed here. If the coming 10-Q shows meaningful customer concentration, the durability of a 66% net margin is a much more open question than I have made it sound. I have not seen that disclosure yet and I am not asserting anything about it.
The comparison set reprices instead. My argument is relative. If Reddit at 35 times is the mistake rather than AppLovin at 25, the gap closes from the other direction and I will have been right about the relationship and wrong about the direction. Relative value arguments fail this way more often than they fail on the analysis.
Growth simply decays. The dullest way to be wrong. Fifty-three percent becomes 47%, then 38%, then 30%, and somewhere in there the multiple I called cheap turns out to have been fair. Every deceleration eventually is the deceleration. I do not think this is that quarter, mainly because of the sequential acceleration in the guide, but that reasoning is exactly what it sounds like when it is wrong.
The thing I am most confident about is the narrowest, and I have deliberately kept it narrow: the only company on this screen growing faster than AppLovin earns less than half its net margin and costs ten turns more. That is a statement about two companies, not a verdict on a sector, and it is the whole of what I would defend. The thing I am least confident about is how long it stays true.
Primary sources
- 8-KQ2 2026 earnings release, Exhibit 99.1All Q2 2026 income statement, balance sheet, cash flow, guidance and non-GAAP figuresAug 5, 2026
- 10-QQuarterly report for the quarter ended March 31, 2026Q1 2026 revenue and diluted EPS of $3.56May 6, 2026
- 10-KAnnual report for the year ended December 31, 2025Full year 2025 diluted EPS of $9.75 used to derive the Q4 2025 quarter; headcount of 898; the October 2025 PSU grant and its market capitalization milestonesFeb 19, 2026
- 10-QQuarterly report for the quarter ended September 30, 2025Q3 2025 revenue of $1.405B and diluted EPS of $2.45Nov 5, 2025
- XBRLAppLovin diluted earnings per share, all filed periodsThe quarterly EPS series summed to trailing twelve month EPS of $13.01Retrieved Aug 5, 2026
- DataQuotes, market capitalizations and peer financialsAppLovin close of $417.92 at 19:59 UTC and after-hours prints of $326.66, $334.49, $322.92 and $345.70 at 20:36, 20:41, 20:48 and 21:44 UTC; the peer table and peer chart are pinned to the 20:41 print and the earnings chart to the 20:36 print; peer market caps at the same session closeRetrieved Aug 5, 2026
Disclosure, again. I own AppLovin and doubled my position during the selloff described above, so I profit if you agree with me. I may buy or sell it at any time. This is not investment advice, I am not a licensed advisor, and nothing here recommends buying, selling or shorting any security. The following are arithmetic on filed figures rather than disclosures, and are labeled where they appear: all multiples, earnings yields, market capitalizations, enterprise values and PEG-style ratios; trailing twelve month EPS and net income; the derived fourth quarter 2025 EPS; days sales outstanding; operating and net margins for quarters where the company did not state them; sequential and annualized growth rates; and every peer P/E in the comparison table, which I computed as market capitalization divided by trailing twelve month net income rather than taking a vendor figure. Consensus estimates are not filed figures and published versions of them differed across outlets for this quarter, so I have described the revenue miss as under one percent rather than citing a single number. Prices are timestamped and were already stale when this published. I have no relationship with AppLovin or any company named here.