









Correction, September 1, 2026. This note argued that Dell's growth structurally dilutes its gross margin. The quarter it was written ahead of, reported the same day, contradicts that. Blended gross margin was 20.9% of revenue, against 18.3% a year earlier and the 17.8% analyzed below, while AI-optimized server revenue doubled to $16.4 billion. Revenue of $47.0 billion beat the $44.0 to $45.0 billion guided, GAAP diluted earnings per share were $6.34 against $4.48 guided, and Dell raised its full-year outlook by $25 billion to $192 billion. The first item in this note's own "What would prove this wrong" section reads: gross margin flat or up while AI revenue grows means the structural claim is wrong. That is what happened. The note stands below unedited, because the argument and the test it set are both still legible, and the test is the reason this is visible at all. The 20.9% and 18.3% are our arithmetic on the income statement in the second-quarter release, now added to the sources.
Chart title, September 13, 2026. The gross margin chart below was titled "Dell’s gross margin has fallen in every quarter since it peaked." Its own bars rise from 18.3% to 20.7% in the quarter ended October 31, 2025, so the title said something the chart does not show. It now reads "Dell’s gross margin has stayed below its peak in every quarter since," which is what the chart, its caption and the text beside it have always said. No figure changed, and it is the only change to the note since publication.
Disclosure. Convexity builds research tools for public-market data. This note is analysis, not investment advice, and nothing in it is a recommendation to buy, sell, or short any security. We hold no position in Dell Technologies, in any company named below, and no relationship with any of them. Dell figures come from earnings releases furnished with Forms 8-K, and from the quarterly financial data Dell files with the SEC, all linked at the bottom. Where a number is our arithmetic on Dell's disclosed figures rather than a figure Dell reported, we say so in the sentence that uses it. Memory contract price figures are TrendForce's published estimates, retrieved 2026-08-30, and are neither Dell's costs nor ours. The identification of Dell's largest AI customers, the SpaceX and xAI merger terms and the draft registration figures attributed to them are press reports rather than Dell disclosures, attributed and dated at the point of use, and Dell does not name the customer discussed below. Dell reports its fiscal second quarter after the close on September 1, 2026, and nothing here anticipates that result.
Dell's first quarter was read almost everywhere as a blowout, and on the lines most people looked at, it was. Record revenue of $43,842 million, up 88%. Operating income up 214%. Diluted earnings per share of $5.24 against $1.37, up 282%. A record $51.3 billion of AI backlog and a raised full-year AI server expectation of $60 billion.
Two lines further down the same income statement, gross margin was 17.8% of revenue against 21.1% a year earlier. That is 337 basis points, in a quarter where revenue nearly doubled.
It is not a one-quarter wobble. Five quarters ago Dell's gross margin was 23.7%. The decline since then tracks the arrival of AI servers almost exactly, and nothing has gone wrong to cause it. It is what growth looks like at Dell now: the fastest-growing part of the company is the least profitable part per dollar of revenue, so the more of it Dell sells, the lower the blended margin goes.
Quarterly figures through the fiscal first quarter of 2027, ended May 1, 2026. Revenue and segment figures are Dell's; the gross margin percentages, the products margin and the 65% comparison are ours, computed from the income statements and segment tables in the releases cited below.
How Dell got to $113 billion
Some history, because the margin argument only makes sense against what this company was.
Dell went private in 2013 in a leveraged buyout with Silver Lake, bought EMC in 2016 for about $67 billion in what was then the largest technology acquisition ever, returned to public markets in 2018, and spun off VMware in 2021. What was left afterwards is the company in question: a hardware business selling PCs, servers, storage and networking, with Michael Dell retaining effective control.
That business was not growing before AI arrived.
| Fiscal year ended | Net revenue |
|---|---|
| Jan 28, 2022 | $101.2B |
| Feb 3, 2023 | $102.3B |
| Feb 2, 2024 | $88.4B |
| Jan 31, 2025 | $95.6B |
| Jan 30, 2026 | $113.5B |
Dell was a roughly $100 billion company that shrank by 14% in fiscal 2024 as the pandemic PC cycle unwound, recovered to $95.6 billion, and then went to $113.5 billion. Guidance for fiscal 2027 is about $167 billion at the midpoint, which would be up nearly 50%.
So the entire growth story, from a standing start, is two years old and one product line wide. Everything this note says about margin and concentration is a statement about what that product line is doing to a company that spent the previous decade being a mature, cash-generative, low-growth hardware business.
Five quarters of margin
The single-quarter comparison understates this, so start with the series. These are Dell's filed quarterly figures; the margin percentage is ours.
| Quarter ended | Revenue | Gross profit | Gross margin |
|---|---|---|---|
| May 3, 2024 | $22,244M | $4,851M | 21.8% |
| Aug 2, 2024 | $25,026M | $5,361M | 21.4% |
| Nov 1, 2024 | $24,366M | $5,360M | 22.0% |
| Jan 31, 2025 | $23,931M | $5,678M | 23.7% |
| May 2, 2025 | $23,378M | $4,937M | 21.1% |
| Aug 1, 2025 | $29,776M | $5,447M | 18.3% |
| Oct 31, 2025 | $27,005M | $5,593M | 20.7% |
| May 1, 2026 | $43,842M | $7,782M | 17.8% |
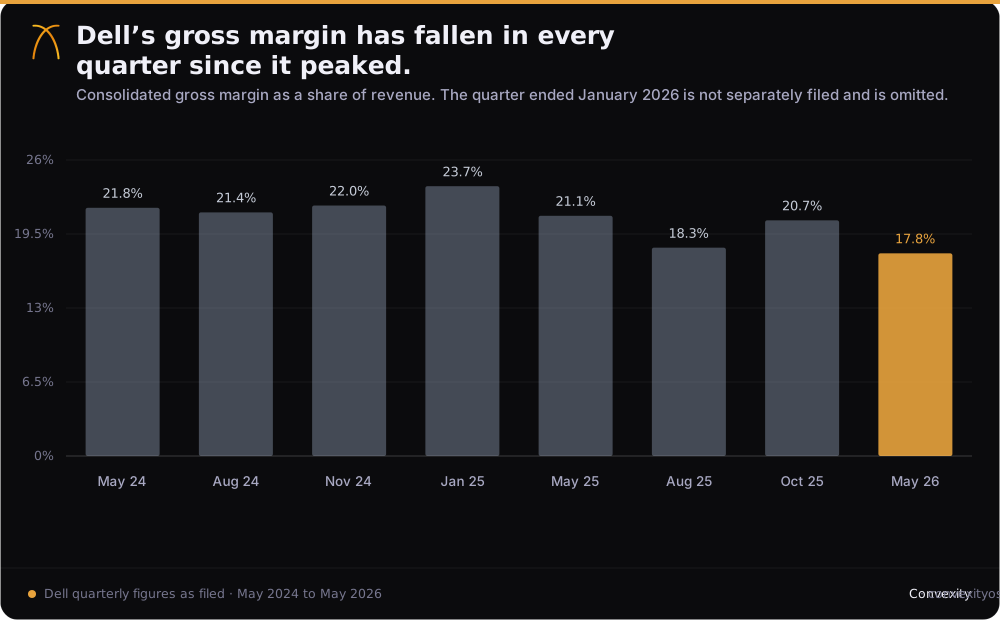
The quarter ended January 31, 2026 is absent, because Dell's fourth quarter is not separately tagged in its XBRL filings; a fourth quarter is derived from the annual figure rather than filed on its own. The series is therefore eight quarters with one gap.
Two things are visible. Gross margin peaked at 23.7% in the quarter ended January 2025 and has been lower in every quarter since, reaching 17.8%. That is 598 basis points peak to trough. And the sharpest single step, from 21.1% to 18.3%, is the quarter ended August 1, 2025, which is the quarter AI server revenue first scaled.
The line is noisy quarter to quarter, because Dell's mix moves with PC seasonality as well as with AI. The direction over five quarters is not noisy.
Where the margin actually went
The compression is not in either segment. It is in the consolidated blend, and its cause is visible in one table Dell prints and almost nobody quotes: the split between products and services.
| Line | Q1 FY27 | Q1 FY26 | Change |
|---|---|---|---|
| Products revenue | $38,105M | $17,599M | +117% |
| Services revenue | $5,737M | $5,779M | -1% |
| Products gross margin (derived) | $5,253M, 13.8% | $2,483M, 14.1% | -32bps |
| Services gross margin (derived) | $2,529M, 44.1% | $2,454M, 42.5% | +162bps |
| Total gross margin | $7,782M, 17.8% | $4,937M, 21.1% | -337bps |
Both components held. Products gross margin fell 32 basis points, which is close to flat. Services gross margin actually improved 162 basis points. And yet the blend fell 337.
That is a mix effect, and a severe one. Products went from 75.3% of revenue to 86.9% of revenue in a single year, by our arithmetic on the revenue lines above. A 14% margin business grew 117% while a 44% margin business shrank 1%, so the average moved toward 14%.
This is the part that matters, because it is not a cyclical dip that mean-reverts. Every incremental dollar of AI server revenue arrives at roughly the products margin. Services revenue, which is the high-margin ballast, is flat in absolute dollars. Dell can grow revenue at 88% indefinitely and the blended gross margin will keep falling toward the products number for as long as the mix keeps shifting.
The reason it has not hurt operating income is operating expense leverage. Total operating expenses grew 9% while revenue grew 88%, so operating margin rose from 5.0% to 8.3% even as gross margin fell. That is a genuinely impressive piece of cost discipline, and it is the strongest argument against this whole note. It is also a lever with a limit. Operating expenses cannot grow slower than revenue forever, and when that gap closes, the gross margin trend is what is left.
How fast the mix moved
The segment history makes the speed of it clear. These are Dell's reported ISG segment figures for fiscal 2026, the year that ended January 31, 2026, against fiscal 2025.
| ISG line | FY2026 | FY2025 | Change |
|---|---|---|---|
| AI-optimized servers | $24,683M | $9,286M | +166% |
| Traditional servers and networking | $19,512M | $17,850M | +9% |
| Storage | $16,631M | $16,457M | +1% |
Then, in the first quarter of fiscal 2027 alone, AI-optimized servers did $16,132 million against $1,882 million a year earlier, growth of 757%.
One quarter of AI server revenue is 65% of what the entire prior fiscal year produced, on our arithmetic on those two figures. That is the speed at which the mix is shifting, and it explains why a margin series that looks gently sloped in the table above feels abrupt in the reported results.
Note also what the other two ISG lines did over a full year: traditional servers and networking grew 9%, storage grew 1%. Storage is the highest-margin hardware Dell sells. It is not growing.
A customer appeared
The margin is half the story. The other half is in the annual report, and it is one sentence.
Dell's Form 10-K for the fiscal year ended January 30, 2026 discloses that one customer accounted for 12% of consolidated net revenue, with substantially all of that revenue attributable to ISG offerings. The same note says that no single customer accounted for 10% or more of consolidated net revenue in either of the two preceding fiscal years.
| Fiscal year ended | Net revenue | Largest single customer |
|---|---|---|
| Feb 2, 2024 | $88.4B | none above 10% |
| Jan 31, 2025 | $95.6B | none above 10% |
| Jan 30, 2026 | $113.5B | one at 12% |
Our arithmetic on those figures: 12% of $113.5 billion is roughly $13.6 billion of revenue from a single counterparty in one year, in a company that had no ten-percent customer at all twelve months earlier. Dell does not name it, and is not required to.
That is a different kind of risk from a margin trend. A blended gross margin drifting down 337 basis points is an arithmetic consequence of mix, and it is visible, gradual and survivable. A customer going from nothing to $13.6 billion is a step change in who Dell depends on, and it happened inside one fiscal year.
Who the counterparty probably is, and why it matters
Dell does not identify the customer. Press reporting consistently names SpaceX and CoreWeave as its two largest AI customers, and separately reports that Dell supplied roughly 50,000 GPUs' worth of systems for xAI's first Colossus cluster, with Supermicro taking the other half of that phase (press reports, retrieved 2026-08-30). We cannot confirm which, if any, of those is the 12% customer, and nothing below assumes we can.
What can be said is that both candidate counterparties changed shape in ways that matter to a supplier.
The two became one. In February 2026, xAI merged into SpaceX at a combined valuation of about $1.25 trillion, reported at the time as the largest merger ever. If Dell was selling to both, its customer concentration increased by corporate action rather than by any sales decision, and the merged entity has since filed to go public.
The credit behind it is not a mature operating business. Reuters, reviewing the draft registration statement, reported the combined company generated $18.67 billion of revenue in 2025 and a net loss of $4.94 billion (press reports, retrieved 2026-08-30). That is a large, well-capitalized, privately held company losing money at scale and funding capital equipment from investment rather than operations.
The other candidate sits inside the circular financing web. CoreWeave rents access to Nvidia chips, has taken equity investment from Nvidia, and Nvidia separately agreed to buy roughly $6.3 billion of cloud services from it. Bloomberg's map of these arrangements, valuations as of June 8, 2026, places CoreWeave in the same web as OpenAI, Nvidia, Oracle and Microsoft.
None of that is an allegation of anything. It is a statement about what stands behind the receivable. A 12% customer whose purchases come out of operating cash flow is an ordinary commercial concentration. A 12% customer funded from capital markets, in a sector where suppliers invest in their own buyers, is a different exposure, and it is the one Dell now has.
What Dell's own backlog definition says
This is also where the $51.3 billion becomes less solid than it reads.
Dell's 10-K defines the term: product backlog is the value of unfulfilled manufacturing orders, and it is included in remaining performance obligations only to the extent the company determines those orders are non-cancelable.
Read that carefully. Backlog as Dell discusses it publicly is a broader figure than the portion that reaches RPO, and the bridge between the two is a company determination about cancelability that is not disclosed order by order. So the headline $51.3 billion is not, on the company's own definition, $51.3 billion of contractually locked revenue. Some portion is, and Dell has not said what portion.
That matters most precisely where the counterparty is weakest. A cancelable order from a company funding itself from capital markets is worth materially less than the same number from a company funding itself from operations, and the disclosure does not let an outside reader separate them.
The half of Dell nobody is talking about
The mix story has a second half, and it runs the other way, so it belongs here rather than in a footnote.
The Client Solutions Group is the PC business. In the first quarter of fiscal 2027 it produced revenue of $14.6 billion, up 17%, with commercial client revenue of $13.0 billion, up 18%, and consumer revenue of $1.6 billion, up 9%. Its operating income was $1.2 billion, up 79%, which the company states as 8.0% of CSG net revenue against 5.2% a year earlier.
So while the consolidated gross margin fell 337 basis points, the PC segment's operating margin expanded by 280 basis points. That is a genuine and underdiscussed improvement, and it is happening in the business everyone had written off as a commodity.
It also complicates the memory argument in the next section, in an interesting way. PCs are the other large consumer of DRAM and NAND, and PC makers have been visibly rationing memory content per device and steering customers toward premium configurations to protect margin. Dell's CSG margin expanding through the worst of the memory repricing suggests the company is capable of passing component costs through when it controls the price list.
Whether that skill transfers to a $51.3 billion AI backlog priced months in advance for a handful of very large, very sophisticated buyers is exactly the open question, and it is one where the honest answer is that a PC price list and a hyperscaler contract are not the same instrument.
Why 13.8% is the number, structurally
It is worth being precise about why the products margin is so thin, because "mix" describes what happened without explaining it.
Dell does not make the expensive part of an AI server. The accelerator does most of the work and carries most of the bill of materials, and Dell buys it. What Dell supplies is the chassis, the power and thermal design, the integration, the validation, the supply chain and the delivery, plus the service contract wrapped around it. That is a real and difficult business, and it is a systems integration business rather than a silicon business.
Three consequences follow, and they all point at the same margin.
The supplier sets the input price. The largest component in the machine is sourced from a vendor with pricing power and no comparable alternative at scale. Dell's ability to expand gross margin on an AI server is bounded above by what that vendor leaves on the table.
The competition has a lower cost structure. Dell competes for these orders against Supermicro and HPE, and, more importantly, against the original design manufacturers such as Quanta and Wistron that sell directly to the largest buyers with almost no brand or channel overhead. A hyperscaler that can buy a rack from an ODM does not need Dell's field sales force.
The customer is sophisticated. The buyers in this segment employ people who know exactly what the components cost. That is a very different negotiation from selling a laptop fleet to a mid-market enterprise, which is the business the 44% services margin comes from.
Put together, a 13.8% products gross margin is not a temporary bad patch. It is roughly what integration is worth when the component is scarce, the buyers are large and informed, and the alternative suppliers are cheaper. That is the number the memory question then lands on.
Management says the same thing about the margin
Two statements from the earnings call held the same day settle the mechanism, and they come from the company rather than from us.
On the margin, the CFO said gross margin rate was 18.1% on a non-GAAP basis, "driven primarily by mix shift to AI servers, with AI revenue up nearly 9x year-over-year," and then added the sentence that matters: "Excluding the impact of AI mix, gross margin rate was up."
That is the argument of this note, stated by the company. The margin decline is not deterioration in any underlying business. It is the arithmetic of selling far more of the least profitable thing. Our figures are GAAP and theirs are non-GAAP, which is why 17.8% and 18.1% differ, but the direction and the cause are the same.
The company also quantified the offset. Operating expenses fell 610 basis points to 8.4% of revenue, described as the lowest level in over 20 years. That is a remarkable number and it is the whole reason operating income rose while gross margin fell. It is also, as noted above, a lever with a floor: operating expense cannot keep falling as a share of revenue indefinitely, and 8.4% after twenty years of grinding is not obviously a number with much left in it.
On the constraint, Jeff Clarke was direct: "Demand continues to exceed supply, with memory as the primary constraint, and we expect to exit the year with meaningful backlog." He went further, describing the effect on customer behaviour: "The memory uncertainty is driving customers to proactively secure access to infrastructure across both traditional and AI workloads over longer periods of time."
That is worth pausing on, because it partly reframes the backlog. If customers are ordering earlier and further out because they are worried about securing memory, then some portion of a record backlog is a supply-anxiety artifact rather than a pure demand signal. Both readings are consistent with the same number, and the company has described the mechanism that produces the second one.
One number that argues against this note
In fairness, the call also contained the strongest counterargument to the concentration section, and it did not come from us.
Dell said its AI customer count surpassed 5,000, with growth across neocloud, sovereign and enterprise customers.
Five thousand customers is not a concentrated book. It sits awkwardly beside a 12% single customer, and both are true: a long tail of thousands of buyers can coexist with one counterparty at $13.6 billion. But it does mean the business is broadening underneath the concentration, and a reader weighing this note should weigh that too. If the tail grows faster than the head, the concentration disclosed in the fiscal 2026 annual report may prove to be the peak rather than a trend.
The receivable is growing faster than the revenue
There is one more thing in the balance sheet that the income statement does not show, and it connects the margin argument to the counterparty argument.
| Balance, quarter end | May 1, 2026 | May 2, 2025 | Change |
|---|---|---|---|
| Accounts receivable, net | $25.9B | $9.8B | +164% |
| Inventory, net | $15.1B | $7.4B | +104% |
| Quarterly revenue | $43.8B | $23.4B | +88% |
Receivables grew nearly twice as fast as revenue. Our arithmetic on those figures: days sales outstanding went from about 38 days to about 54 days, an increase of roughly sixteen days, computed as receivables divided by average daily revenue in each thirteen-week quarter.
Some of that is ordinary. Large enterprise and hyperscale deals carry longer terms than a consumer PC sold on a card, and a mix shift toward very large orders lengthens collection mechanically. Dell also runs a financing business whose receivables are reported separately from this line, so this is the trade balance rather than the whole credit picture.
Even allowing for all of that, the direction is worth naming. Dell is shipping more machines, to a smaller number of larger customers, at a thinner margin, and waiting about two weeks longer to be paid for them. Inventory has doubled at the same time, which is the other half of the same working capital story: more cash tied up in parts before the revenue is recognized, in a period when those parts are repricing upward.
There is a third line that completes it, and it is the one that explains how Dell funded the build.
| Balance, quarter end | May 1, 2026 | Jan 30, 2026 | Change |
|---|---|---|---|
| Accounts receivable, net | $25,854M | $17,585M | +$8,269M |
| Inventories | $15,052M | $10,437M | +$4,615M |
| Accounts payable | $45,261M | $33,630M | +$11,631M |
Our arithmetic on those balances: receivables and inventory together absorbed about $12.9 billion of additional working capital in a single quarter, and payables supplied about $11.6 billion of it, or roughly 90%. Dell financed the build almost entirely by stretching its own suppliers. Payables now stand at 39% of total assets, and days payable outstanding is about 114 on the quarter's cost of revenue.
That is why operating cash flow was still a record $4.1 billion in a quarter where the balance sheet expanded enormously. It is also a position that only works while suppliers accept it.
And one more line, which the release labels plainly and nobody discusses. Dell's total liabilities of $116,317 million exceed its total assets of $114,913 million. Stockholders' equity is negative $1,404 million, a deficit, the legacy of the leveraged buyout, the EMC acquisition and years of buybacks that have taken treasury stock to $16.1 billion.
A stockholders' deficit at a company generating $11.2 billion of annual operating cash flow is not a solvency concern and should not be read as one. It does mean Dell has no equity cushion in the accounting sense, and that its capacity to absorb a shock, whether a memory cost step or a large customer failing to pay, runs through cash generation rather than through a balance sheet buffer.
That is a coherent picture rather than an alarming one. But it is the picture of a business whose economics are moving toward those of a contract manufacturer, and away from those of the company that used to earn 23.7% gross margins selling servers and storage to enterprises.
The backlog and the parts inside it
Now the part that is a claim about the future rather than a reading of the past, and it should be treated as the weaker half of this note.
The AI backlog has moved like this: roughly $9 billion as of late February 2025, a record $43 billion entering fiscal 2027, and $51.3 billion at the end of the quarter ended May 1, 2026. In that most recent quarter Dell booked $24.4 billion of AI orders and recognized $16.1 billion of AI server revenue.
Backlog is an order priced today and delivered later. The revenue is contracted. The cost of building it, in general, is not.
The largest bought-in cost inside an AI server that is not the accelerator is memory, and memory has repriced violently. TrendForce's published contract price estimates, retrieved 2026-08-30, put conventional DRAM up 93% to 98% quarter over quarter in the first calendar quarter of 2026, up a further 58% to 63% in the second, and up 13% to 18% in the third. NAND ran a similar path: up 55% to 60%, then 70% to 75%, then 10% to 15%.
Our arithmetic on the midpoints of those published ranges: DRAM contract prices compound to roughly 3.6 times their fourth-quarter-2025 level by the third quarter of 2026, and NAND to roughly 3.1 times.
Four caveats, all of which cut against the strong version of this argument:
- Those are contract indices, not Dell's costs. Dell buys under long-term agreements it does not disclose. An index is an upper bound on the pain, never a measurement of it.
- Backlog is not necessarily fixed-price. Large AI server agreements frequently carry component pass-through or repricing terms. Dell does not disclose the mix, so nobody outside the company knows how much of the $51.3 billion is genuinely price-locked.
- Dell hedges. Prepaid inventory and non-cancellable purchase commitments are the standard tools, and they are disclosed in the Form 10-Q rather than in the release.
- The margin decline so far is demonstrably mix, not cost. Products gross margin fell only 32 basis points. If memory were already eating the margin, that line is where it would show, and it has not yet.
What can be said without overreaching is narrower, and still worth saying: Dell's products gross margin is 13.8%. At that level, a single-digit percentage move in an input cost that cannot be passed on is a large proportion of the margin, and the company is carrying a $51.3 billion order book into the most violent memory repricing in a decade. That is a risk with a visible size, not a prediction.
What the buyback is doing to the per-share line
One more thing worth separating out, because it flatters everything above it.
Dell's weighted-average diluted share count went from 727 million in the quarter ended May 2024 to 656 million in the quarter ended May 2026, a reduction of 9.8%. Earnings per share therefore grew faster than earnings did, in every quarter of that series.
That is a legitimate and shareholder-friendly use of cash and we are not criticizing it. It does mean that the 282% growth in diluted earnings per share overstates the growth in the underlying business by a few points, and that anyone using EPS as the summary statistic for this quarter is combining an operating result with a capital allocation decision.
The other side of the same trade
There is a company on the other end of the memory cycle. SanDisk reported an 84.6% GAAP gross margin in its fiscal fourth quarter, up 58.4 points year over year, and its cost of revenue actually fell while its revenue rose 372%. We wrote about that quarter in SanDisk's backlog is not the reason to own it.
A gross margin like that is not conjured. It is paid by whoever buys the parts, and server builders are among the largest buyers there are. The memory cycle is usually discussed as a story about memory companies. It is at least as much a story about everyone downstream of them, and Dell is the clearest large-cap example of a company whose reported margin is being shaped from the cost side by it.
The relationship is sectoral rather than bilateral, and we say more about that in The memory cycle is the AI trade.
What the full-year guide is actually asking for
The guidance is worth reading as a set of commitments rather than a single number, because the pieces constrain each other.
Dell has guided fiscal 2027 revenue to about $167 billion at the midpoint, against $113.5 billion in fiscal 2026. That is roughly $53 billion of incremental revenue in one year. It has separately raised its expectation for AI server revenue to about $60 billion, against roughly $24.7 billion of AI-optimized server revenue in fiscal 2026.
Our arithmetic on those two figures: the AI line is expected to add about $35 billion, which is roughly two thirds of the total increase. The remaining third has to come from traditional servers, storage and PCs, which in fiscal 2026 grew 9%, 1% and modestly respectively.
Two things follow. The first is that the mix shift this note describes is not slowing, it is accelerating, and by the company's own plan. If AI servers go from about 22% of revenue to about 36% while carrying the products margin, the blended gross margin has further to fall arithmetically, before any component cost or pricing effect.
The second is that $60 billion of AI server revenue against a $51.3 billion backlog means the year depends on orders that have not been placed yet, not only on converting what is already booked. The backlog is large, but it is not a year of guided revenue on its own, and the difference has to be won.
What Dell actually sells
For readers who do not track the product line, the two segments are straightforward.
ISG, the Infrastructure Solutions Group, is servers, storage and networking. Inside it, AI-optimized servers are the PowerEdge XE family, the dense multi-accelerator systems built around Nvidia and, increasingly, other silicon. Traditional servers are the rest of the PowerEdge line. Storage is PowerStore, PowerMax, PowerScale and the rest of what came from EMC, and it is the highest-margin hardware Dell sells. It grew 1% in fiscal 2026.
CSG, the Client Solutions Group, is PCs: Latitude and OptiPlex commercial machines, Precision workstations, XPS and Inspiron on the consumer side. Commercial is the great majority of it and the part that matters to margin.
Services, which is where the 44% gross margin sits, cuts across both: deployment, support contracts, managed services and financing through Dell Financial Services.
The reason to lay that out is that it locates the problem precisely. The growth is in one product family inside one segment, sold to a handful of buyers, on silicon Dell does not make. The high-margin ballast, storage and services, is flat. That is the whole argument in one paragraph, and it is the shape of the company the guidance is asking investors to underwrite.
What would prove this wrong
- Gross margin stabilizes or rises. If the second quarter shows blended gross margin flat or up while AI revenue grows, then either the mix has stopped shifting or Dell is pricing better than this note assumes, and the structural claim is wrong.
- The mix stops shifting. The whole argument rests on products growing faster than services. If services revenue inflects, the blend stops deteriorating regardless of what AI does. Dell has been trying to attach more services to AI deployments precisely for this reason.
- The backlog is not price-locked. If Dell discloses meaningful pass-through terms, the memory exposure largely disappears and the second half of this note is moot.
- Operating leverage keeps running. Operating margin rose despite everything above. If it keeps rising, the gross margin trend is an accounting curiosity rather than an earnings problem, and the market is right to ignore it.
- Storage turns. Storage grew 1% in fiscal 2026 and carries the best hardware margin in the company. A storage cycle would lift the blend from the other direction, and Dell has been arguing one is coming.
- The 12% customer is boring. Dell does not name it, and the whole counterparty section rests on press identification we cannot confirm. If the customer is a hyperscaler funding purchases from operating cash flow rather than one of the capital-markets-funded names, the concentration is ordinary and that section is wrong.
- The receivable normalizes. Sixteen days of DSO extension across one year, during a period when the mix shifted violently toward very large orders, is consistent with nothing more than longer contractual terms on bigger deals. If DSO flattens from here, it was mix and not credit.
- Backlog proves largely non-cancelable. Dell's own definition leaves the split undisclosed. If the company quantifies how much of the $51.3 billion sits in remaining performance obligations, and the answer is most of it, the backlog is firmer than this note allows.
Dell's guidance for the second quarter is revenue of $44.0 billion to $45.0 billion, with GAAP diluted earnings per share of $4.48 at the midpoint, and a full-year revenue outlook of $167 billion at the midpoint, up nearly 50%. The company reports after the close on September 1, 2026. Two disclosures will not appear in the release at all and are worth waiting for: the customer concentration note, which only updates annually, and the portion of backlog the company treats as non-cancelable, which it has never quantified. Both bear on this argument more than the quarter does. The line worth finding first in the release itself is not the revenue and not the backlog. It is the gross margin percentage, then the products and services split underneath it, and then the purchase commitments note in the Form 10-Q that follows.
Primary sources
- 8-KDell Technologies delivers first quarter fiscal 2027 financial results, Exhibit 99.1The income statement, products and services split, segment table, backlog, and guidance used throughoutMay 28, 2026
- 8-KDell Technologies delivers fourth quarter and full-year fiscal 2026 results, Exhibit 99.1The full-year ISG segment figures and the $43 billion entering backlogFeb 26, 2026
- 10-QDell Technologies quarterly report for the period ended May 1, 2026Where inventory and non-cancellable purchase commitments are disclosed, which the release does not carryJun 9, 2026
- XBRLDell Technologies quarterly revenue and gross profit as filedThe eight-quarter margin series in the first table, taken from the company facts API rather than retyped from releases
- 10-KDell Technologies annual report for the fiscal year ended January 30, 2026The audited customer concentration note (one customer at 12% of consolidated net revenue, substantially all ISG, against no customer above 10% in either prior year) and the definition of product backlog and its relationship to remaining performance obligationsMar 16, 2026
- PressMusk’s SpaceX combines with xAI at a $1.25 trillion valuationThe February 2026 merger of two companies reported to be Dell customers. Retrieved 2026-08-30Feb 3, 2026
- PressSpaceX and CoreWeave as Dell’s largest AI customersThe identification of the two customers, which Dell does not name. Third-party reporting, retrieved 2026-08-30, not independently verified by us
- 8-KDell Technologies second quarter fiscal 2027 financial results, Exhibit 99.1The quarter this note was written ahead of, and the source of the correction at the top: revenue of $47.0 billion, gross margin of $9,830 million on $46,971 million of revenue against $5,447 million on $29,776 million a year earlier, AI-optimized server revenue of $16.4 billion, and the raised full-year outlook of $192 billionSeptember 1, 2026
- ResearchThe hidden risk in AI circular financingThe Nvidia and CoreWeave arrangements referenced here. Retrieved 2026-08-30. Bloomberg maintains a map of the same deals with valuations as of June 8, 2026
- CallDell Technologies Q1 fiscal 2027 earnings call transcriptThe management statements quoted here: non-GAAP gross margin of 18.1% and that excluding AI mix the rate was up, operating expense at 8.4% of revenue, memory as the primary constraint, the effect of memory uncertainty on customer ordering, and the AI customer count surpassing 5,000. Held May 28, 2026, the same day as the releaseMay 28, 2026
- TrendForceContract price estimates for DRAM and NAND flash, 1Q26 through 3Q26Third-party estimates, retrieved 2026-08-30. Not Dell's costs and not ours
- ConvexitySanDisk's backlog is not the reason to own itOur note on the supplier side of the same memory cycle, including the 84.6% gross margin quarterAug 5, 2026
Correction. The structural claim in this note, that Dell's growth dilutes its gross margin, was contradicted by the fiscal second quarter reported on September 1, 2026, and is corrected at the top of this page. The second-quarter figures used there are Dell's as filed, except the gross margin percentages of 20.9% and 18.3%, which are our arithmetic on the income statement in that release. Nothing below this line has been altered since publication, except the gross margin chart’s title, corrected on September 13, 2026 and noted at the top.
Disclosure, again. Convexity builds research tools for public-market data. This note is analysis, not investment advice, and nothing in it is a recommendation to buy, sell, or short any security. We hold no position in Dell Technologies or SanDisk and no relationship with either company. Every reported figure is from the filings cited above. The following are ours, derived by arithmetic on those figures and not reported by Dell: all gross margin percentages including the eight-quarter series and the 598 basis point peak-to-trough change, the products and services gross margin dollars and percentages, the 337 basis point consolidated change and its 32 and 162 basis point components, the products share of revenue of 86.9% and 75.3%, the observation that one quarter of AI server revenue equals 65% of full-year fiscal 2026 AI revenue, the 9.8% reduction in weighted diluted shares, consolidated operating margin of 8.3% and 5.0%, and the 280 basis point expansion in Client Solutions Group operating margin, which is the difference between the 8.0% and 5.2% figures Dell states. The quarter ended January 31, 2026 is absent from the margin series because Dell does not separately file quarterly figures for its fourth quarter, which is noted in the text. Memory contract price ranges are TrendForce's published estimates retrieved 2026-08-30; the compounding to roughly 3.6 and 3.1 times is our arithmetic on the midpoints of those ranges and describes an index, not any cost Dell pays. Dell does not disclose its component costs, its long-term supply agreements, or the pricing terms inside its backlog, and the section discussing them is explicitly framed as a risk of unknown magnitude rather than as a finding. Accounts receivable, inventories, accounts payable, total assets, total liabilities and the stockholders' deficit are balance sheet lines as filed in the earnings release; the share of the working capital build funded by payables, the 39% of total assets and the days payable outstanding are our arithmetic on them. Accounts receivable and inventory are the balance sheet lines as filed; the days sales outstanding figures of about 38 and about 54 days, and the growth rates alongside them, are our arithmetic on those balances against quarterly revenue, and exclude the separately reported receivables of Dell's financing business. The 12% customer concentration, the absence of a ten-percent customer in the two prior years, and the backlog definition are Dell's own audited disclosures; the roughly $13.6 billion is our arithmetic on the 12% and the filed revenue. Dell does not name that customer and we do not claim to know its identity. The identification of SpaceX and CoreWeave as Dell's largest AI customers, the SpaceX and xAI merger, and the revenue and loss figures attributed to the combined company are press reports retrieved 2026-08-30, not independently verified by us, and are presented as candidates rather than as the disclosed customer.