









Disclosure. Not investment advice, and nothing here is a recommendation to buy, sell or hold any security. A member of the Convexity team holds the SPDR S&P 500 ETF (SPY), a fund that tracks the broad stock market and whose value moves with interest rates; no other position. Figures are from the Bureau of Economic Analysis, the Bureau of Labor Statistics, the Labor Department and the Treasury, and from the Federal Reserve's statements, projections, minutes and calendar, the preliminary transcript of the chair's October 28 press conference, and speeches posted by the Board of Governors and the Federal Reserve Bank of Cleveland. The closing note lists what is our arithmetic. This note was drafted with Claude.
The Federal Reserve held its interest rate on Wednesday and said it wanted more information. On Thursday morning it got a great deal of it.
On October 28 the Fed's policy committee kept its target range for the federal funds rate at 3.75% to 4%, six weeks after raising it by a quarter of a percentage point. Ten members voted for the hold. Two, Governor Lisa Cook and Cleveland Fed President Beth Hammack, voted to raise the rate again.
The rest of the committee may not be far behind them. In September, 16 of the 18 officials who submitted projections pencilled in at least one more increase this year, and December 8 and 9 is the only meeting left.
At 8:30 the next morning the Bureau of Economic Analysis published two reports. The economy grew at a 3.4% annual rate in the third quarter, up from 2.2%. The price index for personal consumption expenditures, the inflation gauge the Fed targets, rose at a 2.1% rate, down from 5.0%. Read quickly, the first number takes away the argument for waiting and the second hands it back.
We do not think the second number does. The quarter's 2.1% is an average that sets a summer lull in energy prices against a September in which they reached a new high for the year. Measured over the last three months or the last twelve, the same index rose at about a 3.6% pace. Growth and inflation point the same way, and they point toward the increase most officials projected in September.
What points the other way is the household. Real disposable income, income after taxes and inflation, fell 0.3% in September. Over the past year spending has grown faster than income, and the difference has come out of savings: households saved 3.8% of their income in September, the smallest share since October 2022. That, together with the slowest hiring since 2012, is the case for waiting that Thursday's data left standing.
BEA, GDP advance estimate for the third quarter and Personal Income and Outlays for September, both October 29, 2026; Federal Reserve, Summary of Economic Projections, September 16, 2026. The June-to-September rate is our arithmetic on BEA's monthly index.
What the committee said, and what it left out
Under Chairman Kevin Warsh the statement runs to four short paragraphs, which makes every changed word easy to find. Beyond the decision itself, October's statement differs from September's in three places. "Economic activity is expanding at a solid pace" became "at a strong pace." The second is the sentence that explained the policy decision, and the third is the dissent.
In September the committee wrote: "Today's policy action will support a timelier return to the Committee's 2 percent goal." In October it wrote: "The accumulation of more information will help the Committee determine the policy stance appropriate to ensure a timely return of inflation to the Committee's 2 percent goal." Everything else is word for word, including "Inflation remains elevated" and the closing line, "The Committee will deliver price stability."
The more telling change happened earlier and was not reversed. In June and July the statement said inflation was elevated "in part reflecting supply shocks that have driven price increases in certain sectors, including energy," and it named "the conflict in the Middle East." In September both phrases went, replaced by "geopolitical developments."
October kept that wording. A committee preparing to look through an energy shock would have reason to say so, and this one stopped saying it two meetings ago.
Warsh went further at the press conference. "Energy and related prices have moved higher again in recent weeks," he said. "And our job is to ensure that relative price changes in some sectors do not broaden out across the economy, and that inflation expectations remain as they are anchored." Asked about households, he said consumers "go to the gas station too. And they see that prices are up."
The votes trace a committee leaning one way. In July it held at 3.5% to 3.75% by 9 to 3, with Hammack, Neel Kashkari of Minneapolis and Lorie Logan of Dallas voting to raise. In September it raised by 12 to 0. In October the hold drew two dissents for a further increase, one of them from a governor.
Hammack explained her thinking in a speech on October 12. "When feasible, I generally think it's preferable to make smaller adjustments, and to do so relatively quickly, rather than to wait and risk needing a larger course correction," she said, and added: "With each passing month, persistently elevated inflation raises the risks of an inflationary mindset becoming entrenched in the economy."
By Thursday afternoon neither she nor Cook had published a statement on the October vote. They may soon: Warsh said the quiet period ends "on Friday or at some point over the weekend." As for guidance: "I don't believe in forward guidance absent exigent circumstances, absent a crisis," he said. The statement offers no hint about December; the officials who might are about to start talking.
Warsh also changed the meeting calendar, though not by cutting the number of meetings. The committee keeps eight a year, but starting next fall one 2027 meeting "will focus exclusively on broad monetary policy strategy, with neither a vote on the federal funds rate nor a policy statement anticipated."
That leaves seven rate decisions in 2027 (our arithmetic), and he expects two strategy meetings and six policy meetings in 2028. The calendar the Fed has posted still lists eight 2027 dates without saying which one changes.
The growth Warsh described before it was published
On Wednesday, Warsh previewed the quarter the BEA would report the next morning. The third quarter "appears to have brought an even more rapid advance," he said, "led by healthy consumer spending, likely running above 3 percent growth, and business investment, likely rising at about a double-digit pace." On Thursday consumer spending came in at 3.8%, business investment at 12.7% and spending on equipment at 20.9%, all at annual rates.
The cleanest single measure of that demand is what the BEA calls final sales to private domestic purchasers: consumer spending plus business and home investment, leaving out inventories, trade and government. It grew at a 4.9% rate, up from 4.6% in the second quarter and the fastest since the second quarter of 2021. In 2025 its quarterly pace ranged from 1.8% to 3.2%.
That is the number that matters for inflation, because it measures how hard Americans and their employers are spending. It is also not where the headline acceleration came from. GDP growth rose by 1.2 percentage points between the second and third quarters, and consumer spending and fixed investment together accounted for only 0.3 points of the change.
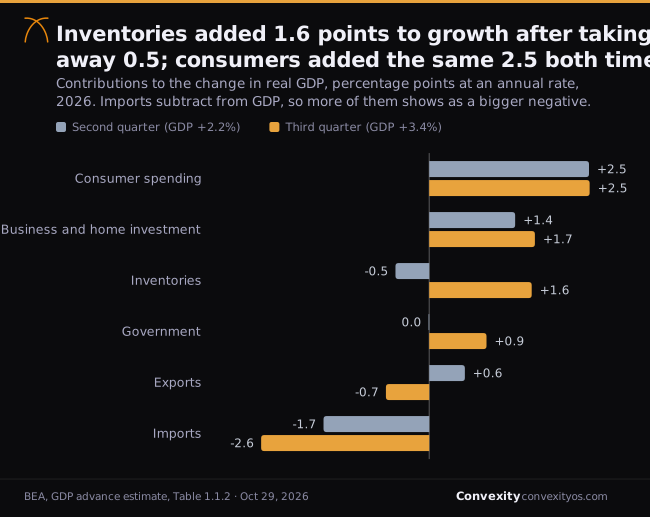
The rest came from two places. Businesses added to inventories, which contributed 1.6 points after subtracting 0.5 in the spring, a swing of 2.1 points and the largest inventory contribution since the first quarter of 2025. The BEA says the build was led by wholesalers and manufacturers of nondurable goods. Government added 0.9 points after adding nothing.
More than half of the government figure is an accounting effect. The BEA records sales from the Strategic Petroleum Reserve as a cut in federal spending. The reserve sold less oil in the third quarter than in the second, so measured nondefense spending rose, which the release says has "no direct effect on GDP" because the oil sold shows up elsewhere in the accounts. Defense added 0.4 points.
Trade pulled the other way. Imports rose at a 19.7% annual rate, led by capital goods other than autos. The BEA says equipment spending was led by computers and peripherals, measured largely from import data, so the same machines appear twice: as investment that adds to GDP and as imports that subtract. Net exports took 3.3 points off growth, the biggest drag since early 2025.
Final sales of domestic product, which is GDP without inventory investment, grew only 1.7%, slower than the second quarter's 2.8%. So the headline overstates how much faster output grew. Domestic buyers spent at the fastest pace in five years, and much of what they bought, led by computers, was made abroad.
Warsh had said that "High-tech investment is leading the acceleration," and the AI buildout behind it has been financed partly with long-dated bonds. Asked how much demand is adding to inflation, Warsh wondered aloud whether the economy is running too hot and answered: "That isn't the judgement of most of my colleagues." He credited productivity. Strong demand alone did not move the majority. Inflation would have to.
Why the quarter's 2.1% is not the number to watch
The third-quarter PCE price figure compares the average level of prices in July, August and September with the average in April, May and June, then expresses the change as an annual rate. By that measure prices rose at a 2.1% rate after 5.0%, and prices excluding food and energy, the core measure, at 2.5% after 3.3%.
Averages hide timing. The BEA's energy price index for consumers rose 20.5% from February to September (our arithmetic). It peaked in May, fell in June and July, then climbed in August and September to a level above May's, the highest of the year. Because the quarter averages three months, the third quarter's average energy price sat below the second quarter's even though September ended at a new high.
Energy added 1.85 points to the second quarter's inflation rate and took away 0.14 points in the third, a swing of about 2 points on its own. Core prices contributed 3.0 points, then 2.2. Most of the fall from 5.0% to 2.1% is the summer dip in fuel, which September undid. The supply side of that story is in our note on U.S. shale and $100 oil.
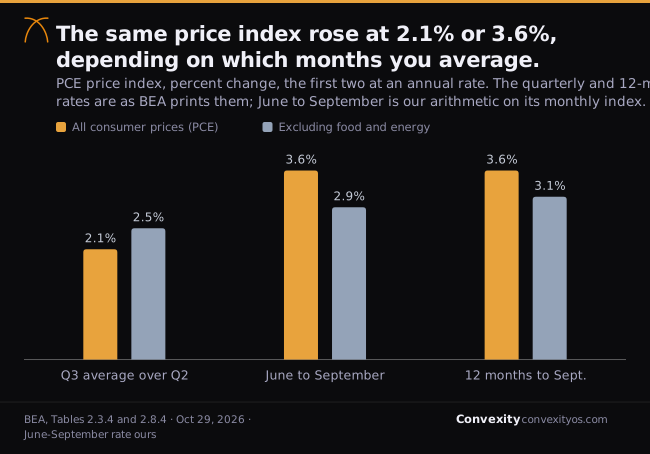
Measure from June instead and the picture changes. From June to September, PCE prices rose at a 3.6% annual rate (our arithmetic). Starting in June flatters the rise, because June was a cheap month for energy. The 12-month change, which starts and ends in September and so has no such problem, gives the same answer: 3.6%, as the BEA prints it. In September alone, prices rose 0.5%.
Core inflation is less dramatic, and the softness in it was real for a while. Core prices rose 0.13% in June and 0.14% in July, the slowest two months of the year, then 0.26% in August and 0.32% in September (our arithmetic on the index). Over those last two months core prices rose at about a 3.5% annual rate. Over twelve months they rose 3.1%.
A narrower measure, services excluding energy and housing, rose 3.6% over the year. It covers things like health care, dining and insurance, and it is where a fuel shock would show up as broader inflation if it were spreading, because those prices tend to follow wages and businesses' own costs.
The hypothesis we set out to test was that December turns on which inflation measure the committee believes: the soft quarterly figure or the firm monthly one. Lined up, they do not disagree. They describe different windows of the same path, and the committee's statement of its longer-run goals, reaffirmed in January, defines the 2% target as the annual change in the PCE price index. That is the 3.6%.
The committee's own forecast is the better yardstick. In September the median official projected PCE inflation of 3.7% and core inflation of 3.4% for 2026, measured from the fourth quarter of 2025 to the fourth quarter of 2026. Through the third quarter, core prices are up 2.4% on that basis (our arithmetic). Reaching 3.4% would take core inflation at about a 3.9% annual rate in the last quarter.
That sounds like room for the doves, but not much. If core prices keep rising at September's 0.3% a month through December, core inflation ends the year at about 3.3% (our arithmetic), a tenth below the median projection. For headline PCE to reach 3.7%, prices would need to rise at about a 3.5% rate in the fourth quarter, close to their pace since June.
So inflation is running roughly where officials expected when 16 of the 18 projected another increase. Nothing in Thursday's price data says they were wrong. If the committee is still leaning against December, the reason has to be somewhere else.
The soft spot is the household
It is in the other half of the income report. Real disposable personal income fell 0.3% in September as prices rose 0.5% and incomes 0.2%. Real consumer spending was flat, up less than 0.1%. Over the past year, real income rose about 1% and real spending 2.5% (our arithmetic). Spending can outgrow income only if saving falls, and it has.
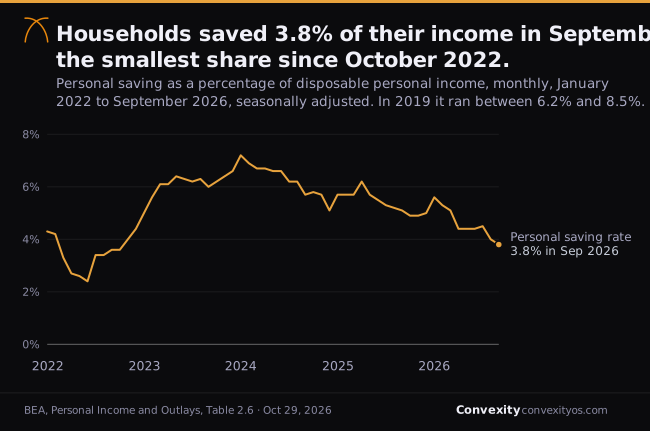
The saving rate was 5.1% in September 2025 and 3.8% in September 2026. In 2019, before the pandemic, it ran between 6.2% and 8.5%. The third quarter's strong 3.8% growth in consumer spending came while the saving rate averaged 4.1%, down from 4.4% in the spring (our arithmetic on the monthly rates). Some of the quarter's demand was paid for by drawing down the cushion.
The committee has noticed. The minutes of the September meeting record that "stock market gains had provided support to consumer spending, particularly among higher-income households." The next sentence reads: "Several participants noted, however, that low- and moderate-income households faced strains, with higher energy prices weighing disproportionately on their real disposable income."
That is the argument for patience, and it is not the one the headline numbers suggest. Higher fuel prices work like a tax on households that cannot easily drive or heat less, and the tax rose again in September. Spending carried by a falling saving rate tends not to last. A committee expecting energy to slow demand on its own could wait in December without being complacent about inflation.
There are signs the strain is not yet showing up as distress. We found in October that the big banks' card borrowers are fine while the jobs hold, and that holiday sales forecasts rest on volume as real wages slip. Both conclusions depend on the same condition: people keeping their jobs. That is where a December increase would bite.
Who would pay for a December increase
The labor market looks steady by the measures the committee watches most. Unemployment was 4.2% in September, and payrolls rose 29,000. Employers added an average of 68,000 jobs a month in the first nine months of 2026, against about 10,000 a month in 2025 (our arithmetic), so Warsh's remark that payroll growth is "noticeably above last year's pace" checks out.
Layoffs remain low. Initial claims for unemployment insurance were 194,000 in the week to October 24, against 221,000 a year earlier, and the four-week average was 196,750, against 226,750. Those figures came out at 8:30 on Thursday alongside the GDP report, and they argue against waiting as clearly as the growth figures do.
Hiring is the weak spot. Employers took on new workers at 3.3% of employment a month in both 2025 and the first eight months of 2026, the pace of 2012 and slower than every year from 2013 to 2024 (our arithmetic on the monthly rates). In 2019 the rate was 3.9%. Governor Cook said on September 30: "Hiring has been more modest in recent years than earlier in the expansion."
That matters most to the 7.1 million people looking for work. In 2026 about 24.5% of unemployed people found a job each month, against 27.5% in 2019 (our arithmetic on the BLS labor force flows). With hiring slow and layoffs rare, the cost of a slowdown lands on people already out of work. A rate increase reaches hiring decisions before it reaches anything else.
Warsh said the committee does not intend to get there through job losses. "The goal, in my view, and you've heard me say this before, isn't to throw sand in the gears of the economy and throw people out of work," he said. "I don't think we have to do that." The mechanism he described is financial conditions. "They've tightened a bit since we met last time," he said.
Market rates tell a more mixed story. The 10-year Treasury yield was 5.01% on September 16, the day of the increase, peaked at 5.31% on October 5 and was 5.05% on October 28. The 2-year yield went from 4.74% to 4.92% on September 28 and back to 4.67%. Warsh himself said that "Interest rates have rolled over to the downside."
Those yields set the price of mortgages and corporate borrowing, and the 10-year now sits 26 basis points below its peak. If the tightening is supposed to come through financial conditions, the bond market has handed back most of the rise that followed the September increase. That cuts toward another increase, not against it, and leaves the household squeeze as the strongest remaining reason to wait.
What arrives before December 9
The committee will see a full set of data before it decides. The Labor Department's employment cost index for the third quarter was scheduled for 8:30 a.m. on Friday, October 30, shortly before this note was published, and is not reflected here. It measures what employers pay in wages and benefits, and it is the release most likely to tell the committee whether services inflation is being fed by pay.
After that the calendar is dense. Job openings and hiring for September arrive on November 3, productivity for the third quarter on November 5, and the October jobs report on November 6. The October consumer price index follows on November 10 and producer prices on November 13. On November 25 the BEA publishes both its second estimate of third-quarter GDP and October personal income and spending.
The last pieces land the week before the meeting: October's job openings on December 1 and the November jobs report on December 4. The November consumer price index is not due until December 10, the day after the decision, so the committee will set the rate without it.
Two of those releases will matter most. The October CPI and PCE figures will show whether September's energy rise carried into the fall, and the November 25 income report will show whether real income recovered or the saving rate fell again. If income keeps falling while prices stay firm, the committee faces the trade-off this note describes at its starkest.
What would prove this wrong
- Energy falls back and core cools. If October's CPI and PCE show energy prices retreating and core prices rising 0.2% a month or less, the quarter's 2.1% will have been the better guide and the 3.6% a passing spike.
- The saving rate is revised up. Early income figures move a lot. If the November 25 revisions lift the saving rate or real income materially, the household argument for waiting weakens.
- Private demand is revised down. The 4.9% is an advance estimate. A large downward revision would restore the argument that growth is slowing on its own.
- The labor market breaks. If the October or November jobs reports show payrolls falling and unemployment rising, the case for waiting becomes about jobs rather than household budgets, and it becomes much stronger.
- The dissenters or the majority explain the hold differently. Once the quiet period ends, officials may say the October pause was about something we have not weighed, such as market volatility or the strategy review. If so, our reading of what is left is wrong.
- Yields climb again. If the 10-year yield returns above its October 5 high before December, the case that markets are tightening for the Fed comes back, and households would no longer be the main argument for waiting.
The data and documents this is built on
- FOMCFederal Reserve, FOMC statement and implementation noteHold at 3-3/4 to 4 percent by 10 to 2; dissents by Cook and HammackOct 28, 2026
- FOMCFederal Reserve, FOMC statementIncrease to 3-3/4 to 4 percent by 12 to 0; the wording October revisedSep 16, 2026
- FOMCFederal Reserve, FOMC statements of June 17 and July 29, 2026The supply-shock and energy language, and the July 9-to-3 voteJul 29, 2026
- TranscriptTranscript of Chairman Warsh's press conference (preliminary)Quotations on growth, energy, forward guidance, financial conditions and the 2027 and 2028 meeting scheduleOct 28, 2026
- SEPFederal Reserve, Summary of Economic ProjectionsMedian 2026 projections for PCE and core PCE inflation and the federal funds rate; Figure 2 counts of 2026 rate projectionsSep 16, 2026
- FOMCFederal Reserve, Statement on Longer-Run Goals and Monetary Policy StrategyThe 2 percent goal, measured by the annual change in the PCE price index; as reaffirmed effective January 27, 2026Jan 27, 2026
- MinutesMinutes of the Federal Open Market Committee, September 15-16, 2026Participants on household finances and consumer spendingOct 7, 2026
- CalendarFederal Reserve, Meeting calendars and informationDecember 8-9, 2026 meeting with projections; eight meetings listed for 2027; read Oct 29, 2026Oct 29, 2026
- SpeechBeth M. Hammack, "Trimming the Sails: Communicating My Reaction Function"On smaller, quicker adjustments and entrenched inflationOct 12, 2026
- SpeechLisa D. Cook, "The Dual Mandate in Rural America"On the pace of hiringSep 30, 2026
- DataBureau of Economic Analysis, Gross Domestic Product, Third Quarter 2026 (Advance Estimate)Tables 1.1.1, 1.1.2, 1.4.1, 2.3.4 and 2.3.8, read from the NIPA flat files posted the same morningOct 29, 2026
- DataBureau of Economic Analysis, Personal Income and Outlays, September 2026Tables 2.6 and 2.8.4: PCE and core price indexes, energy and services excluding energy and housing, real disposable income, real spending, saving rateOct 29, 2026
- DataBureau of Labor Statistics, The Employment Situation, September 2026Payrolls, unemployment and the number unemployed; labor force flows for the job-finding sharesOct 2, 2026
- DataBureau of Labor Statistics, Job Openings and Labor Turnover Survey, August 2026Monthly hires rate since 2001, via the BLS Public Data APISep 29, 2026
- DataU.S. Department of Labor, Unemployment Insurance Weekly ClaimsWeek ending October 24, seasonally adjusted, with the year-earlier comparisonOct 29, 2026
- DataU.S. Treasury, Daily Treasury Par Yield Curve Rates, 20262-year and 10-year yields, September 16 to October 28Oct 28, 2026
- CalendarBureau of Labor Statistics and Bureau of Economic Analysis release schedulesDates for the employment cost index, JOLTS, productivity, jobs, CPI, PPI, GDP and personal income releases through December 10Oct 29, 2026
Not investment advice. This note is an analysis of public data and Federal Reserve documents, published for research purposes, and not a recommendation to buy, sell or hold any security. A member of the Convexity team holds SPY, a broad-market fund whose value moves with interest rates; no other position. This note was drafted with Claude.
What here is ours rather than the sources'. As published: GDP growth, every contribution to it and every growth rate by component, including private final demand and final sales of domestic product; the quarterly PCE and core inflation rates, the 12-month rates and the September monthly changes; the energy and core contributions to quarterly inflation; the monthly price indexes; real disposable income's September change and the saving rate; the payroll, unemployment and hires figures; the claims figures; the Treasury yields; the Fed's decisions, votes, projections and calendar; the definition of the 2% goal; and every quotation, which is from the Fed's statements, minutes and preliminary press conference transcript, or from speeches as posted by the Board and the Cleveland Fed. Ours: the swings in contributions between quarters and the "largest since" and "fastest since" comparisons; the 2025 range of private final demand; the June-to-September and August-to-September annualized rates; the energy index's change since February and its position against May; the core monthly changes to two decimals; the 12-month change in services excluding energy and housing; the inflation through the third quarter and the fourth-quarter pace each projection would require, including the 3.3% year-end core figure at 0.3% a month; real income's and real spending's 12-month changes; the quarterly averages of the saving rate and the "smallest since" comparison; the payroll averages for 2025 and 2026; the annual averages of the hires rate and every comparison between years built on them; the job-finding shares, from the BLS labor force flows; the yield changes in basis points; the seven 2027 rate decisions; and the reading of the household squeeze as the remaining case for waiting. Each derived figure is recomputed in the figure files published with this note.